

Image Source: Pixabay
- This ETF trading model uses the Conference Board Leading Economic Index to determine “Risk-On” periods for equities.
- A universe is defined from the SPDR, Vanguard, and PowerShares ETF providers for the sectors of healthcare, energy, communication, technology, and general multi-sector funds, holding large-mega cap stocks from the United States.
- The model selects 3 ETFs from the previously defined universe at the beginning of a “Risk-On” period and holds these ETFs continuously until the end of the “Risk-On” period.
- During “Risk-Off” periods for equities it goes to the gold ETF (GLD) to maximize returns. ETF (BND) is also a suitable alternative to GLD.
- The simulation shows that this strategy would have produced over 7-times the total return of SPY with similar risk.
This low turnover model uses a combination of a measure of the economic performance of the United States, market trend indicators, and momentum signals to identify three ETFs likely to perform best at a particular time. Thus, it is only applicable to U.S. based equity ETFs.
Timing the Stock Market
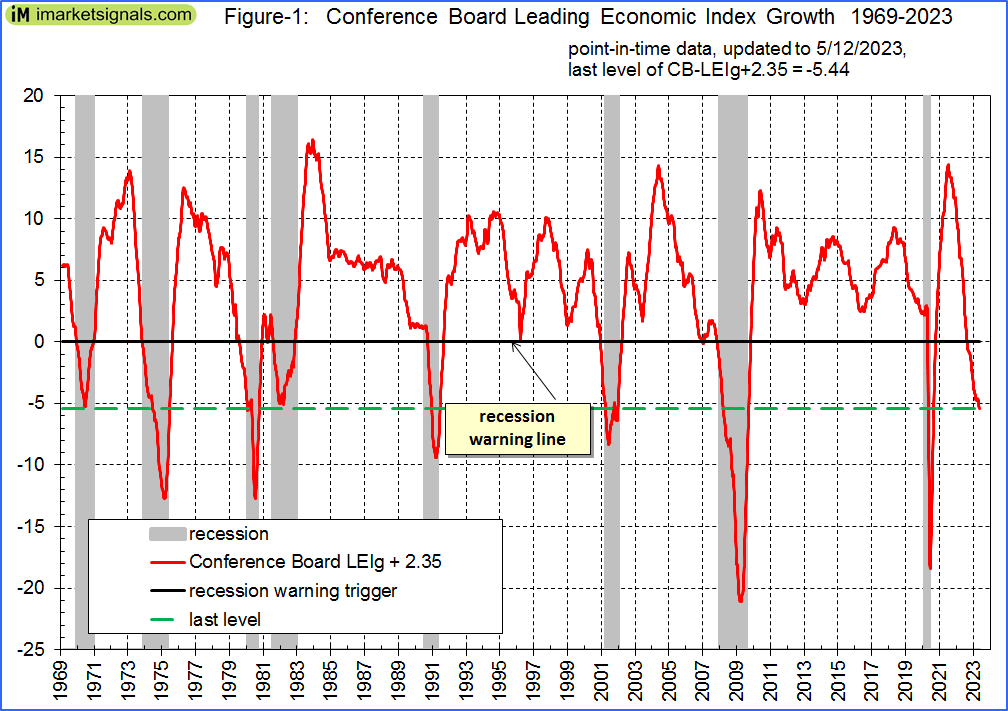
To time the stock market, it uses the publicly available monthly data of the Conference Board Leading Economic Index (LEI) from which the weekly LEIg is derived. LEIg is the six-month smoothed annualized growth rate of the LEI, with 2.35% added to it to make zero the recession-indicating trigger. This means that if the LEIg falls below zero, it may indicate that the economy is entering a recession.
Adding 2.35% to the growth rate is meant to account for the fact that the economy may experience growth below trend without necessarily being in a recession. The formula for LEIg is in the appendix. Figure-1 shows the LEIg from 1969 to 2023. LEIg currently is at -5.44%, indicating that the U.S. economy is either in, or near recession.
According to the model, “Risk-On” applies when the Simple Moving Average (SMA) of the LEIg over a five-week period is greater than or equal to -1%, then the model goes long (i.e., buys equity ETFs).
Alternatively, to profit from a trend reversal of LEIg when it is negative, i.e., when the SMA of the LEIg over a five-week period is less than -1% but greater than -5%, and is also greater than the SMA of the LEIg over a 15-week period, then the model goes long as well.
When none of these conditions exist, “Risk-Off” applies and the model buys the Gold ETF (GLD). This is the current holding since Nov. 7, 2022.
ETF Selection
To avoid survivorship biased selection, a universe of ETFs is initially defined from the SPDR, Vanguard, and PowerShares ETF providers for all the ETFs from the sectors of healthcare, energy, communication, technology, and general multi-sector funds, all holding large-mega cap stocks from the United States.
Currently, the universe holds 27 ETFs and is reproduced in the appendix. There were only eight ETFs available in the Portfolio 123 database at the beginning of the backtest period in 1999.
Three ETFs are selected at the beginning of each “Risk-On” period from the universe of ETFs, with the public Portfolio 123 ranking system “ETF Rotation – Conservative,” and they are held continuously until the end of the “Risk-On” period. Only a total eleven different ETFs were selected by the rankings system over the full backtest period.
“Risk-On” periods identified by LEIg:
| 1/4/1999 | – | 1/22/2001 |
| 1/22/2002 | – | 12/31/2007 |
| 10/19/2009 | – | 5/11/2020 |
| 9/28/2020 | – | 11/7/2022 |
Performance from January 1999 to April 2023
The simulated performance is shown in Figure-2. The model shows an annualized return of 15.2% with a maximum drawdown of -30%. There have been only 15 realized trades, all of them winners. The minimum holding period for equity ETFs was 749 days, and 140 days for the ETF (GLD). The current holding is GLD since Nov. 7, 2022, returning 19.4% to April 20, 2023.
The risk statistics using the industry standard calendar monthly returns show similar Standard Deviations for the model as for benchmark ETF (SPY). Thus, the risk associated with the model is not higher than holding SPY, while the total return over the backtest period would have been more than about 7-times higher than for SPY.
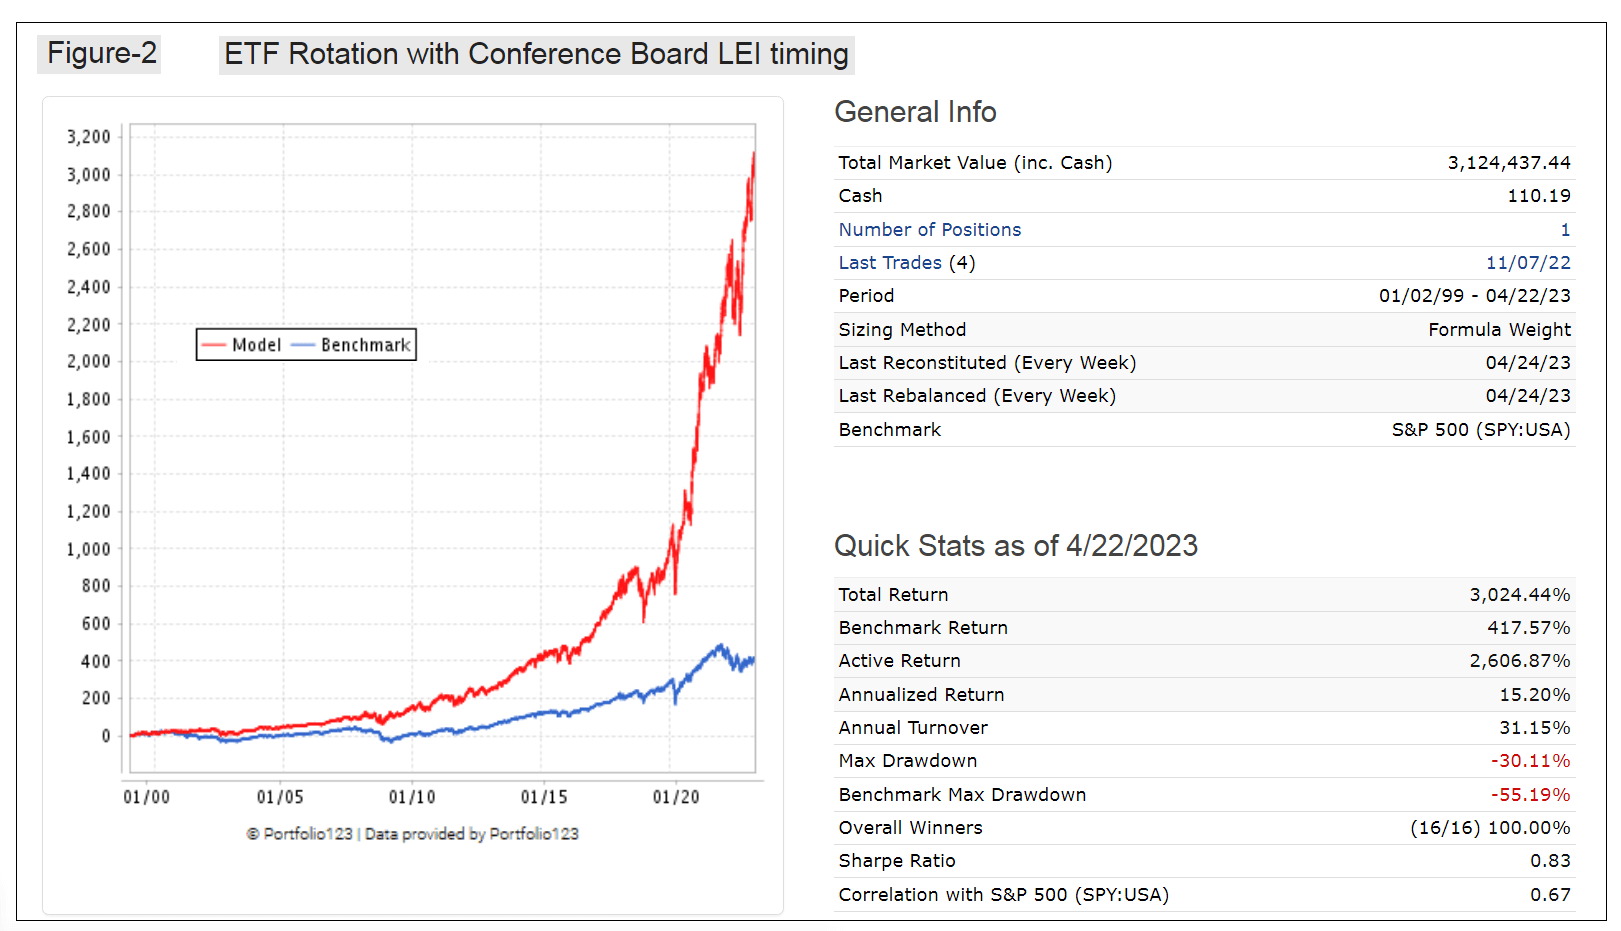
If the “Risk-Off” investment was ETF (GLD) and bond ETF (BND) equal weight, then this strategy would show an annualized return of 14.6%.
Conclusion
From this analysis it would appear that signals from the Conference Board Leading Economic Index of the direction of the U.S. economy can be profitably employed to determine “Risk-On” periods for the stock market, and to out-perform with minimum effort a buy-and-hold strategy of SPY.
This model can easily be replicated because the data and ranking system is publicly available. For convenience, this model is also available at iMarketSignals to subscribers.
Appendix
A1. Formula for LEIg:
- “MA1” = 4 week moving average of the LEI
- “MA2” = moving average of MA1 over the preceding 52 weeks
- “n”= 52/26.5
- “m”= 100
- LEIg = [m*(MA1/MA2)^n] – m + 2.35
A2. The ETF Universe from which ETFs are selected by the ranking system:
|
Ticker |
Name |
Family |
Style |
Sector |
| PBUS | Invesco PureBeta MSCI USA ETF | PowerShares | General | General |
| QQQ | Invesco QQQ Trust | PowerShares | General | General |
| DIA | SPDR Dow Jones Industrial Average ETF Trust | SPDR | General | General |
| ONEY | SPDR Russell 1000 Yield Focus ETF | SPDR | Equity Income | General |
| SPLG | SPDR Portfolio Large Cap ETF | SPDR | General | General |
| SPTM | SPDR Portfolio Total Stock Market ETF | SPDR | General | General |
| SPY | SPDR S&P 500 ETF Trust | SPDR | General | General |
| SPYD | SPDR S&P 500 High Dividend ETF | SPDR | Equity Income | General |
| SPYG | SPDR Portfolio S&P 500 Growth ETF | SPDR | Growth | General |
| SPYV | SPDR Portfolio S&P 500 Value ETF | SPDR | Value | General |
| XHS | SPDR S&P Health Care Services ETF | SPDR | General | Healthcare |
| XLC | The Communication Services Select Sector | SPDR | General | Telecomm |
| XLE | Energy Select Sector SPDR Fund | SPDR | General | Energy |
| XLK | Technology Select Sector SPDR Fund | SPDR | General | Technology |
| XLV | Health Care Select Sector SPDR Fund | SPDR | General | Healthcare |
| XNTK | SPDR Morgan Stanley Technology ETF | SPDR | General | Technology |
| XSW | SPDR S&P Software & Services ETF | SPDR | General | Technology |
| MGC | Vanguard Mega Cap Index Fund | Vanguard | General | General |
| MGK | Vanguard Mega Cap Growth ETF | Vanguard | Growth | General |
| MGV | Vanguard Mega Cap Value ETF | Vanguard | Value | General |
| VONE | Vanguard Russell 1000 ETF | Vanguard | General | General |
| VONG | Vanguard Russell 1000 Growth Index Fund | Vanguard | Growth | General |
| VONV | Vanguard Russell 1000 Value Index Fund | Vanguard | Value | General |
| VOOG | Vanguard S&P 500 Growth ETF | Vanguard | Growth | General |
| VOOV | Vanguard S&P 500 Value ETF | Vanguard | Value | General |
| VTV | Vanguard Value Index Fund | Vanguard | Value | General |
| VV | Vanguard Large-Cap Index Fund | Vanguard | General | General |
A3. Trades
Note: Pct Return does not include dividends.
|
Symbol |
Open |
Close |
Days |
Pct Return |
| GLD | 11/7/2022 | holding | — | — |
| XLE | 9/28/2020 | 11/7/2022 | 770 | 158.00% |
| ONEY | 9/28/2020 | 11/7/2022 | 770 | 31.50% |
| SPYD | 9/28/2020 | 11/7/2022 | 770 | 25.20% |
| GLD | 5/11/2020 | 9/28/2020 | 140 | 10.80% |
| QQQ | 10/19/2009 | 5/11/2020 | 3857 | 296.40% |
| XLK | 10/19/2009 | 5/11/2020 | 3857 | 306.90% |
| XNTK | 10/19/2009 | 5/11/2020 | 3857 | 169.40% |
| GLD | 12/31/2007 | 10/19/2009 | 658 | 26.30% |
| SPYV | 1/22/2002 | 12/31/2007 | 2169 | 35.40% |
| SPY | 1/22/2002 | 12/31/2007 | 2169 | 32.40% |
| XLV | 1/22/2002 | 12/31/2007 | 2169 | 27.00% |
| GLD | 1/22/2001 | 1/22/2002 | 365 | 4.90% |
| XLE | 1/4/1999 | 1/22/2001 | 749 | 28.20% |
| VTV | 1/4/1999 | 1/22/2001 | 749 | 19.60% |
| VV | 1/4/1999 | 1/22/2001 | 749 | 10.30% |
More By This Author:
Stocks Are Moderately Overvalued But 10-Year Forward Returns Look Good: Update April 2023
Expect Further Losses For Stocks But 10-Year Forward Returns Look Better: Update December 2022
Expect Further Losses For Stocks But 10-Year Forward Returns Look Better: Update November 2022


Comments
Log in or sign up to join the conversation.