
- The average of the S&P 500 for Nov-2022 was 3,917 (16% down from the Dec-2021 average of 4,675) and is 385 points higher than the corresponding re-calibrated long-term trend value of 3,532.
- For the S&P 500 to reach the corresponding long-trend value would entail a 10% decline from the November average value, indicating that the S&P 500 is not significantly overvalued anymore.
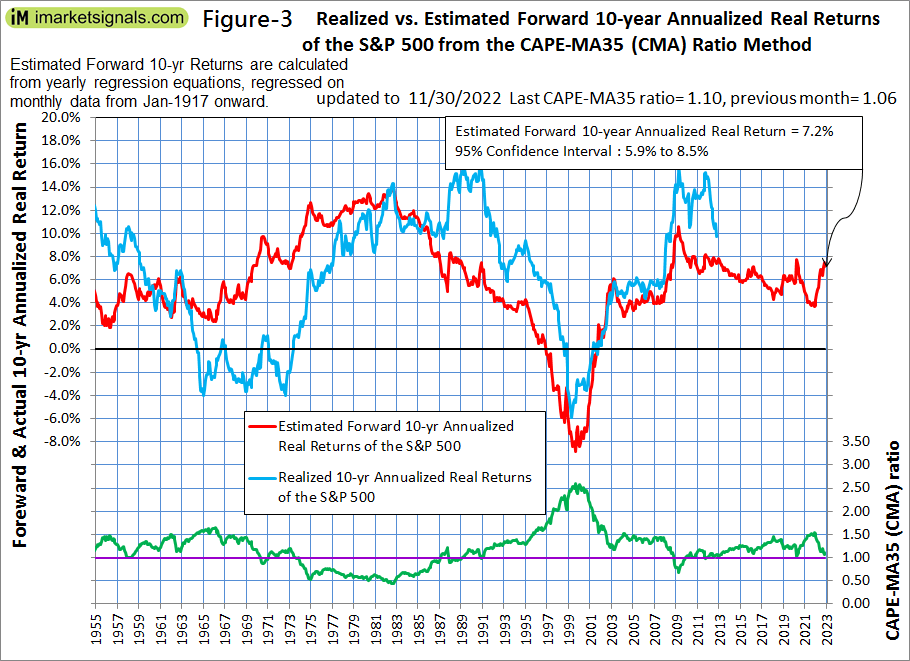
- The Shiller CAPE-ratio is at 28.3, 10% higher than its 35-year moving average (MA35), currently at 25.8, forecasting a relatively high 10-year annualized real return of about 7.2%.
- The long-term trend indicates a forward 10-year annualized real return of 5.5%
- However, rising inflation with a falling CAPE-MA35 ratio, similar to what occurred in the period 1964-1973, implies very low or negative 10-year forward annualized real returns.
This is an update to our series of articles started in 2012 assessing market valuation and estimating forward stock market returns. The most recent previous update was for October 2022.
The December 2021 update concluded that the then prevailing condition of overvaluation suggested zero returns from stocks to the end of 2028 and the danger of an imminent major downturn for equities. By end of February 2022, the S&P 500 was 5% lower and since then the index has declined further as predicted in the March, July, and September 2022 updates, now having declined a total of 16% from December 2021 average.
The projections here are partly based on Estimating Forward 10-Year Stock Market Returns using the Shiller CAPE Ratio and its 35-Year Moving Average, which is referred to as the “referenced article” further down.
What short-term stock market returns can be expected?
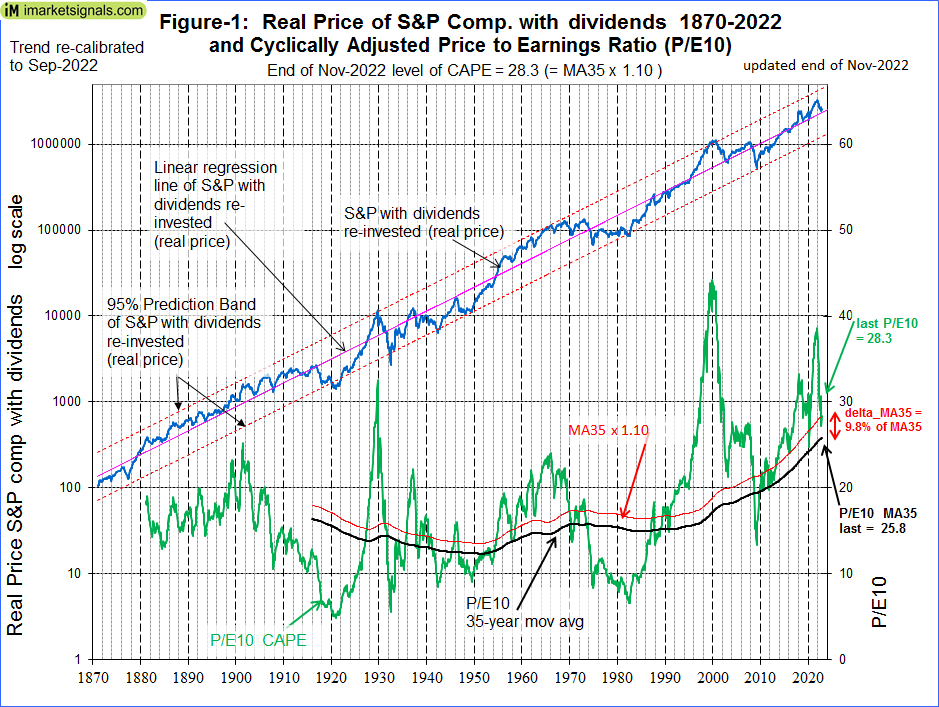
Nobody knows, and the best one can do is to use the historic data (which is from Shiller’s S&P series) to guide us to make estimates for the future. From the real price of the S&P-Composite with dividends re-invested (S&P-real), one finds that the best-fit line from 1871 onward is a straight line when plotted to a semi-log scale. There is no reason to believe that this long-term trend of S&P-real will be interrupted.
S&P-real and the recalculated best fit line together with its 95% prediction band lines are shown in Figure 1, updated to the end of November 2022. (See the appendix for the equations which now include an additional 10 years of data in the regression analysis after July 2012.)
The S&P-real average November level of 3,917 is now 10% above the long-term trend line (Figure 2), above the mean trend level of 3,532.
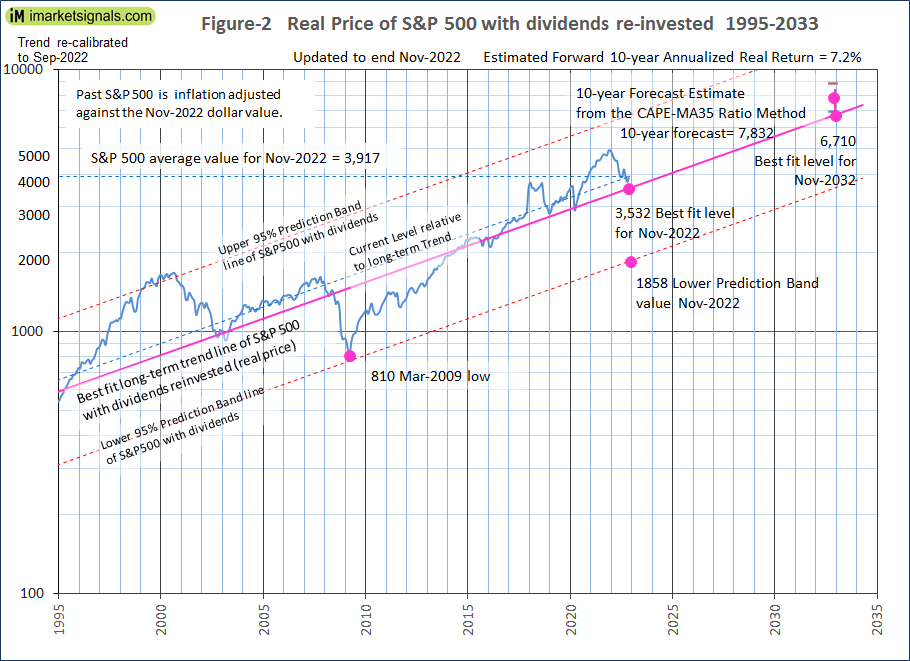
In Figure 2 the current level of the S&P 500 relative to the long-term trend is indicated by the line parallel to the long-term trend line. Note that this relative level is now about the same as it was at the end of 2007 prior to the 55% decline of the S&P 500 to the March 2009 low. So it is possible for the S&P 500 to produce a similar decline from the current level.
Forecasting stock market returns with the CAPE-MA35 Ratio
Also shown in Figure 1 is the CAPE-ratio (which is the S&P-real divided by the average of the real earnings over the preceding 10 years) and its 35-year moving average (MA35), having the end of November 2022 values of 28.3 and 25.8, respectively. Thus the CAPE is 10% above its MA35 and the S&P-real has now sharply declined from where it was at the end of 2021.
As shown in the referenced article, a superior method to the standard use of the Shiller CAPE-ratio is to predict 10-year real returns using the CAPE-MA35 ratio as a valuation measure. It is simply the value of the Shiller CAPE-ratio divided by the corresponding value of its 35-year moving average (28.3 / 25.8 = 1.10).
Currently, the CAPE-MA35 ratio of 1.10 forecasts a probable 10-year annualized real return of about 7.2% to the end of November 2032. Based on the current S&P 500 value this would indicate an end-of-November 2032 value of 7,832 for S&P-real, with upper and lower confidence values of 8,800 and 6,900, respectively (Figures 2 & 3).
The forecast 10-year annualized real return of about 7.2% is based on regression analysis and may be optimistically high during periods of high inflation. Figure 4 shows the inflation rate, the CAPE-MA35 ratio, and realized 10-year annualized real returns from 1955 onward. One observes that very low or negative 10-year forward annualized real returns followed the period with rising inflation and a falling CAPE-MA35 ratio, 1964-1973.
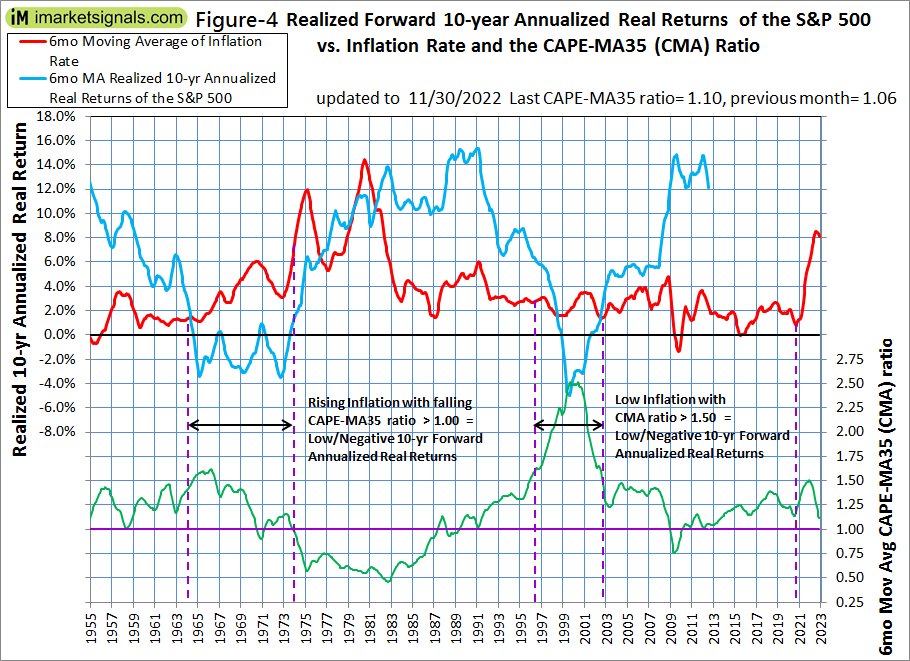
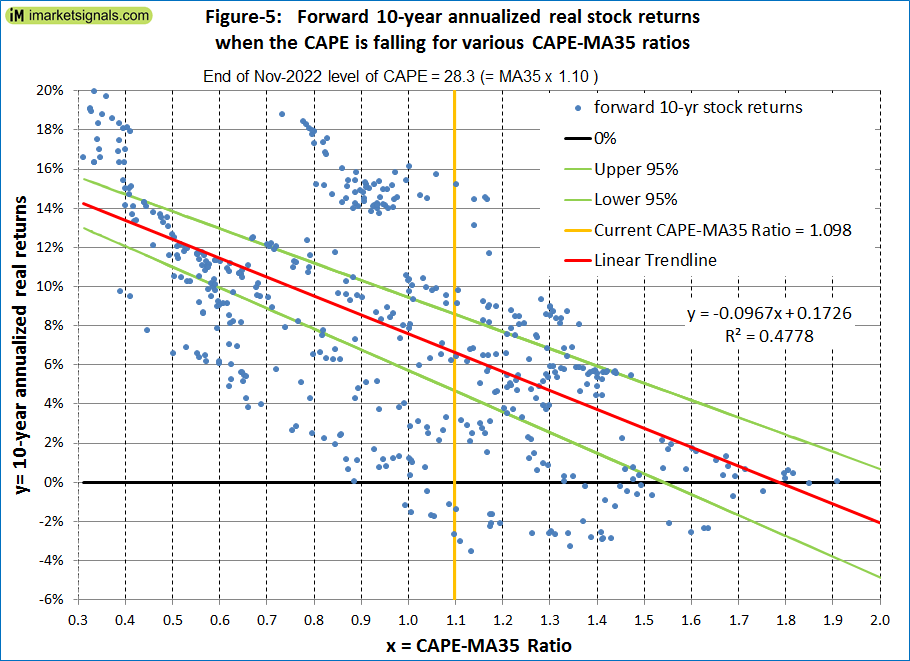
Figure 5 shows the historic forward 10-year annualized real returns when the CAPE was falling for CAPE-MA35 Ratios ranging from 0.3 to 2.0. For the current CAPE-MA35 Ratio of 1.10, the returns ranged from -3% to 15%. One observes that once the CAPE-MA35 Ratio becomes less than 1.0 the forward returns were all positive.
Forecasting returns to 2032 with the long-term trend
When extending the best fit line and the prediction bands (Figure-2), then the S&P-real end of November 2032 value would be 6,710.
Thus the historic trend forecasts a probable total gain of about 71% (or an annualized return of 5.5%) for S&P-real from its end of November 2022 level of 3,917 to the end of November 2032 best-fit level of 6,710.
Conclusion
- The current level of the S&P 500 relative to the current long-term trend level indicates that stocks are moderately overvalued; and
- The current CAPE-MA35 ratio of 1.10 forecasts a relatively high 7.2% real 10-year forward returns for the S&P 500, while the long-term trend indicates a forward return of 5.5%; and
- Current high inflation and a falling CAPE-MA35 ratio may indicate very low, or negative 10-year forward returns for equities, similar to what followed the period 1964-1973; and
- The current condition does not exclude the possibility of a major downturn for equities, but the expected 10-year forward returns look better now than for several previous years.
More By This Author:
Expect Further Losses For Stocks But 10-Year Forward Returns Look Better: Update November 2022Expect Further Losses For Stocks And Very Low 10-Year Forward Returns: Update September 2022
An Upcoming Recession Is Signaled By The Forward Rate Ratio


Comments
Log in or sign up to join the conversation.