


Japan didn’t just spark a currency crisis; it reminded everyone that the Fed has quietly backstopped the dollar for 60 years. The Yen intervention is not new, and while the “end of fiat, buy gold” crowd is right about the destination, they are wrong about the departure time.
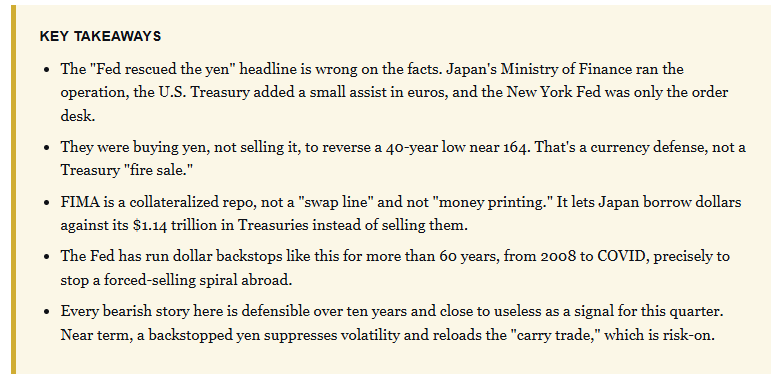
Every time somebody touches the plumbing of the financial system, the same story writes itself on social media before the ink is dry. This month, it was the yen intervention, and over the last couple of weeks, the timeline settled on three conclusions:
The yen intervention was the “end game” for Japan,
Bessent is quietly bailing out the U.S. bond market, and
The whole affair proved “fiat money” is dying, so you had better own gold.
While it is a very compelling story, most of it is wrong. More importantly, the only part that’s right won’t help your portfolio this quarter.
So let’s do the work the timeline skips, starting with separating what actually happened from what the narrative needs you to believe. Then we’ll ask the only question that pays: should any of it change how you’re positioned this morning?
What Actually Happened In The Yen Intervention
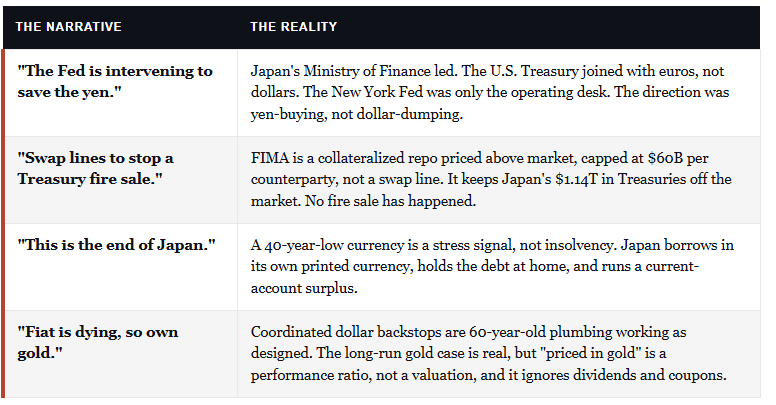
Start with the facts, because the framing is where the damage gets done. This was the first joint U.S.-Japan currency operation since 2011. The yen had slid to about 164 per dollar, its weakest in 40 years, and the entire point of the exercise was to push it back up, not down. Japan did the majority of the heavy lifting, with Tokyo spending roughly ¥8.45 trillion, call it $53 to $59 billion, in one session, with the full week closer to $75 billion. Conversely, the U.S. share was small, maybe $5 to $10 billion, and there is one detail almost nobody mentioned: the Treasury bought yen with euros, not dollars, so it never had to touch the Treasury market to do it.
Read that again, because the entire “Fed is intervening” headline is wrong twice over. The Fed didn’t set monetary policy here, nor did it spend a dime of its own money either. The New York Fed served as the Treasury’s operating desk, which is its ordinary role whenever the U.S. engages in the currency market. Furthermore, the direction ran opposite to the “scare story,” as no one was “dumping dollars.” This was a country buying its own currency off the floor, and doing it with euros.
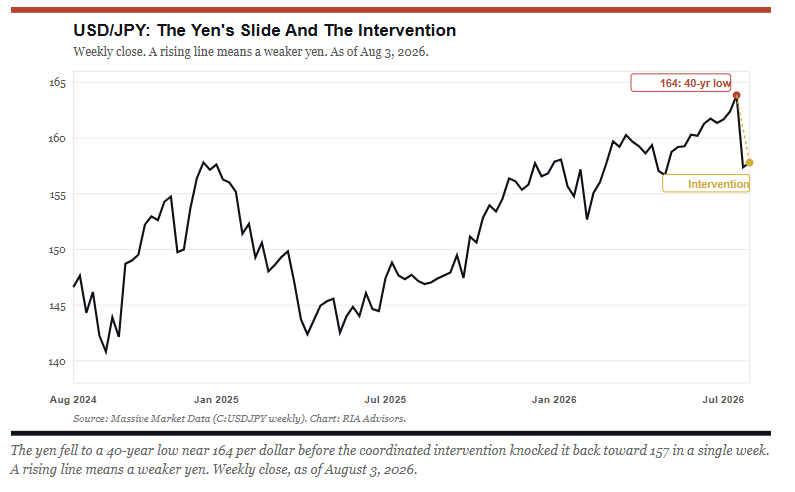
A weak currency is a relative price, whereas a sovereign default is a failure to pay. The yen intervention is firmly the first thing, not the second. Hold onto that, because almost every piece of the doom narrative depends on blurring the two.
Narrative One: “This Is The End Of Japan”
The strongest version of the doom case comes from people worth reading, so let me give it room before I take it apart. Daniel Lacalle put it about as sharply as anyone.
“Japan is not going bankrupt in strict terms; it is demolishing its currency, which is equivalent to an implicit default.”
With its public debt near 250% of GDP, it is clear that these evolutions can last for far longer than anyone could imagine. Lacy Hunt has made the patient version of this for years. Past a certain point, a debt load stops stimulating growth and starts strangling it. Japan crossed that line a long time ago, but they haven’t gone bankrupt yet.
Such is the trouble with the word “default.” A default is a failure to pay a creditor.
Japan borrows in a currency it prints.
It owes that debt mostly to its own citizens,
Runs a current-account surplus, and
Holds the largest net creditor position on the planet.
You can’t force a missed payment on debt denominated in money you print yourself, which is exactly why a country like Japan quietly devalues and inflates its obligations away instead of formally defaulting the way an emerging market saddled with foreign-currency debt eventually must. The issue is NOT whether the yen is weak, as it plainly is, but whether “weak” means “insolvent,” and it doesn’t.
“But Lance, they’re openly wrecking their own currency to pay the bills, and you’re telling me that’s fine?”
No, and I never said it was. A 40-year low is a real stress signal and a genuine policy failure. Japanese savers pay for it in imported inflation every day, and that is a serious problem. It’s just a different problem than the cascading sovereign default the “end game” crowd is selling. Conflating the two is how a slow story gets sold as an imminent collapse.
Narrative Two: “Bessent Is Bailing Out The Bond Market”
Here is a narrative that needs the most attention. The “doomers” claim that the Treasury Secretary, Scott Bessent, is quietly opening “swap lines” to stop Japan from dumping its Treasuries in a “fire sale” that sends U.S. yields screaming higher.
The motive is real, and with the 10-year yield near 4.6%, no one at the Treasury wants the largest foreign holder of American debt selling into a soft market. But that is also the Treasury’s job as the governor of the world’s reserve currency. Both the Federal Reserve and the Treasury provide liquidity when needed to maintain financial stability. Currently, the tool Bessent is using is an expanded FIMA facility that targets that fear directly. However, these are not “swap lines,” and the difference is important to understand.
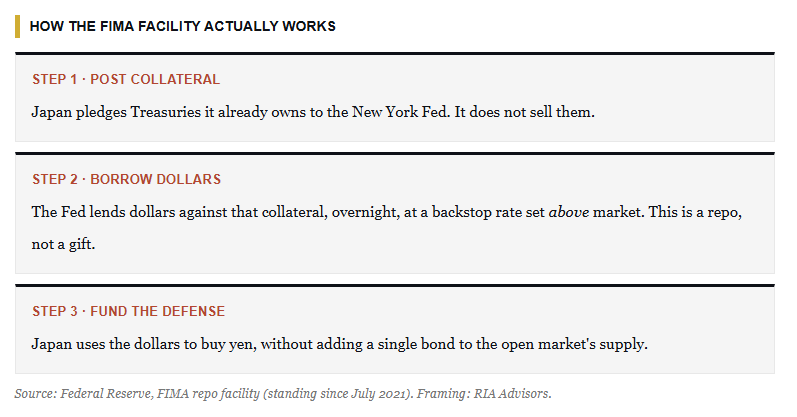
The whole point of the FIMA facility is to provide liquidity to prevent a fire sale that would hurt all parties even more. Think about a pawnshop, where Japan walks in holding an asset it already owns, its Treasuries. It posts them as collateral and walks out with the dollars it needs. It never sells the family silver spoons into a falling market.
However, a “swap line” is uncollateralized lending between central banks. FIMA is a fully collateralized repo, priced above market, so it stays a backstop, capped at $60 billion per counterparty, with any increase requiring an FOMC vote. Ben Emons called it “a bit Kabuki,” and he’s right. Japan already parks around $350 billion in the Fed’s foreign repo pool. This is plumbing, not a rescue.
Lastly, these backstops are not new, which is where the “secret bailout” framing comes apart. The Fed has run a dollar-swap network for more than 60 years. It started in 1962 to help defend the Bretton Woods system. The logic never changes, and all revolves around maintaining financial stability.
When a global panic hits, banks and firms outside the U.S. still owe dollars. If they can’t borrow them, they raise them the hard way, by selling what they own. For foreign institutions, that would mean Treasuries. Therefore, a scramble for dollars would become a dumping of Treasuries, which would spike American yields and freeze the world’s most important market. The whole mess then feeds the very crisis everyone was trying to escape.
Cullen Roche has hammered this for years.
“The dollar isn’t just America’s currency; it is the plumbing of the global system, so a dollar shortage abroad becomes an American problem, too.”
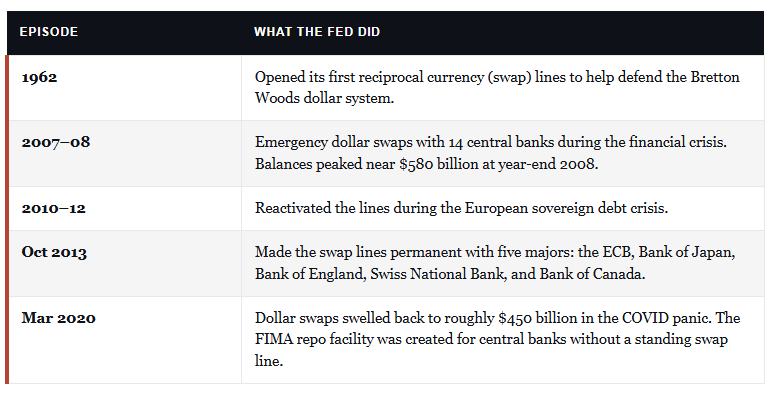
FIMA was built for exactly this problem. Read that bolded sentence again. What’s happening with the yen isn’t a new lever getting yanked for the first time. It’s the same 60-year-old playbook, pointed at Japan. The concern worth holding isn’t a Tokyo fire sale. The plumbing exists to prevent one. It’s the precedent, the slow blurring of the line between the Treasury’s job and the Fed’s. I’ll come back to it.
Narrative Three: “Fiat Is Dying, So Own Gold”
Then comes the punchline every version of this story drives toward. Paper money is being debased; gold is the only “real money,” so sell your stocks and bonds and buy the metal. You’ll see the charts. The S&P “priced in gold,” or the dollar “priced in gold.” They point to these charts and proclaim, “Look what happens once you measure things in something a government can’t print.” It is a neat story. (Read More: Sound Money: Be Careful What You Wish For.)
I’ll handle this one carefully, because I own gold in client portfolios and the long-run case is legitimate.
A chart of any asset priced in gold tells you only one thing, and that is how gold did against that asset, over whatever window somebody picked. That’s it. You could price stocks in houses, or houses in gold, or the S&P in a barrel of oil. Each is an equally valid ratio, but none of them is “the truth.” When a chart shows stocks priced in gold and murmurs “see the problem,” it has already assumed the thing it pretends to prove: that gold, not the dollar, is the right ruler for money.
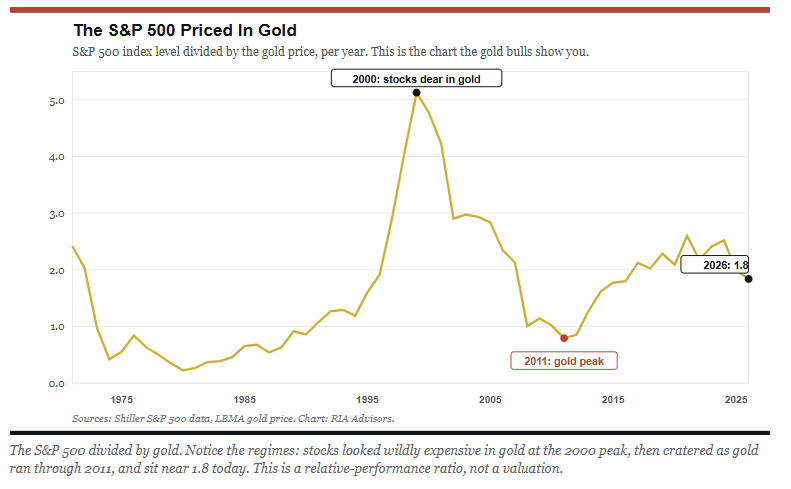
“But Lance, gold doesn’t lie. It’s real money, and everything else is confetti.”
I hear that one a lot, and there’s a kernel of truth in it. Still, two things get buried every time. First, gold is not a fixed yardstick. It fell about 70% from its 1980 peak to its 2000 low. So when the ratio drops, you can’t tell whether stocks got worse or gold just got better. Second, and this matters most, those charts use price alone. Gold pays you nothing, whereas a stock pays dividends, a bond pays coupons, and a house pays rent. Strip the dividends out of the S&P, and of course, it looks sickly next to a metal in a bull market. Put them back, and the “collapse” shrinks fast.
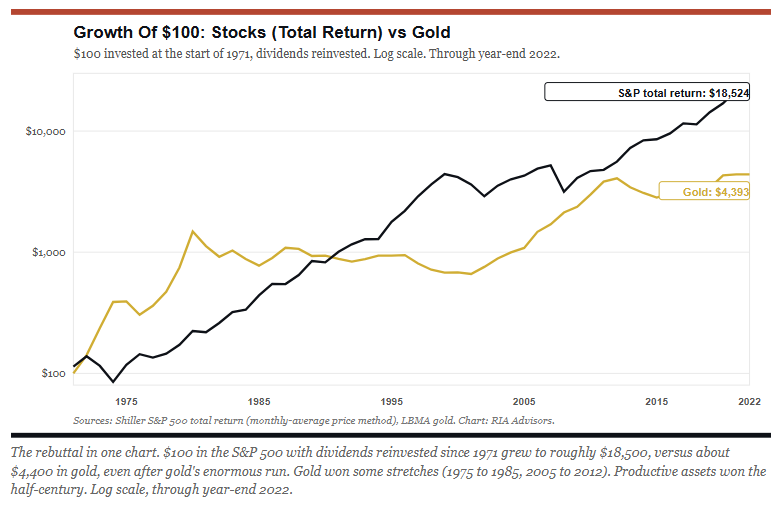
So, yes, I agree with one premise. You should own gold as insurance against inflation, sized as a hedge and never as a religion. Don’t let a rigged denominator argue you out of the assets that actually compound.
Where The Bears Are Right
The bears are not wrong about everything. There are three places where the bears are simply right, and we must acknowledge those points to navigate whatever the future holds more successfully.
The debt math is real, and it’s getting worse, in Japan and increasingly so in the U.S.
Secondly, when the Treasury leans on the Fed’s balance sheet to conduct monetary policy, the wall between fiscal and monetary authority grows thinner. Robin Brooks is right that intervention “treats the symptom, not the disease.” It can manufacture “the illusion that nothing’s wrong” while a real problem compounds beneath the surface.
Lastly, the secular case for gold rests on exactly these dynamics, chronic deficits, and financial repression. That case doesn’t vanish because this month’s panic was overblown.
So, what is the concern, or risk, that actually keeps me up at night? It isn’t a Tokyo fire sale next Tuesday, but rather the slow, almost boring normalization of central banks backstopping government funding, one facility at a time, until the day the market stops believing the backstop was ever meant to be temporary. That day is a genuine threat, but it is also years from the headline that ran this week, and that distance is what matters most.
What The Yen Intervention Means For Investors
Read that last sentence again, because it focuses on the one word the doom narrative never says out loud: timing. Almost every bearish quote in this piece is defensible over five to ten years.
The debt arithmetic,
The debasement,
The creeping fiscal dominance,
The long-run bid under gold.
None of it is fantasy; it is all a very slow grinding transition that will take decades to play out.
The mistake was never being bearish, but collapsing a decade-long thesis into a next-quarter trade is. Any serious analyst will stand on the other side of the timing. BCA Research argues the yen’s slide:
“It reflects the Bank of Japan’s inflationary monetary policy rather than concerns about Japan’s public finances.”
They point to wage growth above 5% for three years and credit growth at a 30-year high. Their conclusion is most crucial to the debate.
“The yen is deeply undervalued and a buy, not a short.
Currently, it seems just about everyone is short the yen, which is a prime setup for a reversal.
So, does any of this put money in your pocket in the near term? Modestly, yes. When Japan funds yen buying through FIMA repo, the Fed’s balance sheet expands for the life of the loan. That’s net new dollar “liquidity” in the system, collateralized and temporary, but real while it’s out there. The bigger effect runs through volatility, and the real danger from a disorderly yen was a rerun of the August 2024 “carry trade” unwind, when the whole world tried to de-risk in a week. Draw a line under the yen, and that tail risk comes off the table for now. A stabilized, still-cheap yen just reloads the carry, and carry-on is “risk-on” for stocks and credit.
So what do you do with all of it?
Stay invested with the trend while the tape and the liquidity backdrop support it.
Treat these events as warnings on the horizon, not triggers for today.
Own your gold and your hedges the way you’d own an umbrella, bought while the sky is still clear, because you never get to buy one once the storm is overhead.
The things that will matter most someday rarely demand that you act this morning. Position for the decade, but trade the tape you actually have. I hope this helps.
Sources & Notes
Fortune, “Bessent joins Japan to help reverse months of yen losses,” Aug 2026.
Al Jazeera, “Japan and US confirm rare joint intervention to prop up yen,” Aug 3 2026.
OMFIF, “Japan’s yen intervention and the US’s unusual support,” Aug 2026.
CNBC, “How Bessent is pushing Warsh’s Fed to expand the FIMA backstop,” Aug 3 2026.
Federal Reserve, FIMA Repo Facility, policy tools; and “Central bank liquidity swaps,” Board of Governors.
Congressional Research Service, “Federal Reserve: Dollar Swap Lines,” IF11498.
Bordo, Humpage & Schwartz, “The Evolution of the Federal Reserve Swap Lines since 1962,” NBER WP 20755.
Ben Emons, “FIMA Kabuki,” FedWatch Advisors Notes, Aug 2026.
Investing.com, “Why did the Japanese yen collapse in 2026?” (BCA Research view).
Fortune, “The yen is quietly crashing… ‘doomed to fail'” (Robin Brooks), Jul 2026.
ZeroHedge, “Japan’s Keynesian Mirage” (Daniel Lacalle).
Data note (replication, per house standard): the “growth of $100” total-return series was rebuilt from Robert Shiller’s monthly S&P 500 dataset using the monthly-average price method, with dividends reinvested. Endpoints were cross-checked against known annual returns (2008, 2013, 2022); individual calendar-year returns can run 2 to 5 points off exact month-end figures, so the chart is used for the long-run comparison, not precise annual quotes. Gold is the LBMA annual price. Series runs through year-end 2022.



Comments
Log in or sign up to join the conversation.