


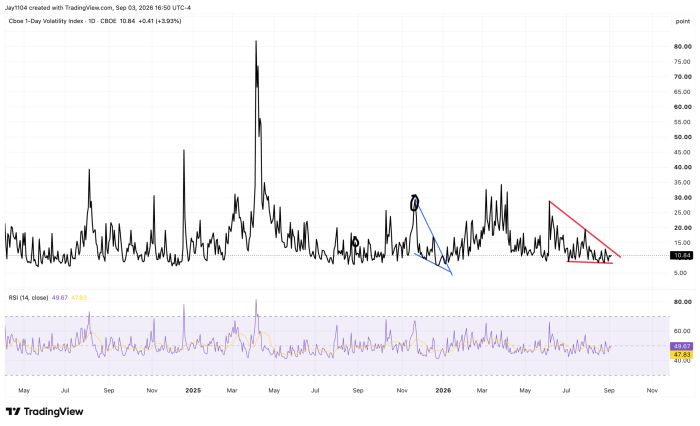
Tomorrow is the jobs report, and the market seems to have a strange way of expressing any sign of nervousness. The VIX 1-day rose on the day to 10.9. Maybe the jobs report won’t matter. The jobs data has been so bad for so long that it may no longer matter. Hey, the unemployment rate could even fall because more people simply decide to retire and leave the labor force.
What it does suggest, though, is that the odds of a post-report volatility crush tomorrow are very low.
In other news, the yen strengthened on the day, with USD/JPY falling by 1.85% as traders added to bets that the BOJ will hike rates. I mean, they probably should have been raising rates faster quite some time ago. But now they are going to get serious. OK.
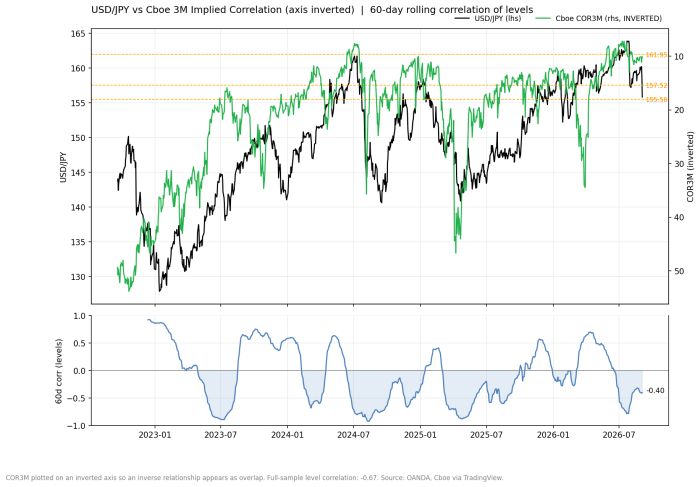
Anyway, given that USD/JPY is falling, I thought I would bring back the three-month implied correlation chart. In 2024, COR3M bottomed on July 3, and USD/JPY peaked a week later, on July 10. In 2026, COR3M bottomed on July 10, and USD/JPY peaked on July 28, less than three weeks later. Twice in a row, the low in implied correlation has marked the top in the dollar-yen. Chance? Maybe. But it is getting harder to argue that.
But the 60-day rolling correlation indicates a relationship between the two. If that relationship persists, then a stronger yen could lead to higher implied correlations and, ultimately, higher index volatility.
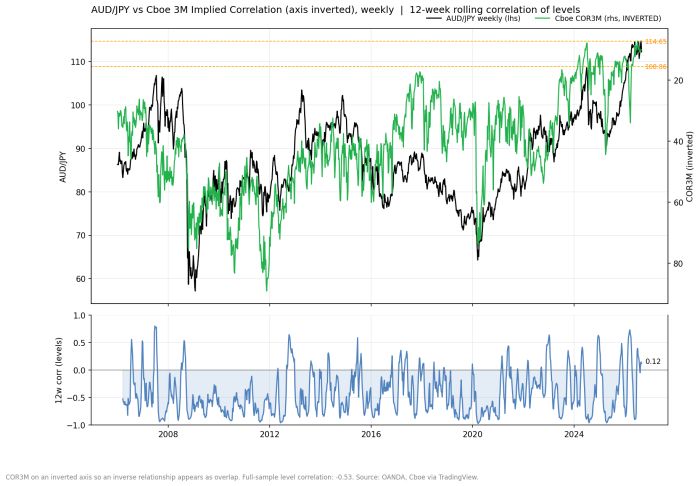
The relationship exists across the different yen FX pairs, with AUD/JPY being another important FX carry-trade pair. This is a weekly chart going back to 2006. The COR3m is inverted to make the relationship easier to see, while the 12-week rolling correlation roughly corresponds to a 60-day rolling correlation.
The point is that, over nearly 20 years, this relationship has predominantly existed in a negative-correlation regime, with spikes into positive correlation relatively rare. We are in one of those positive-correlation periods right now, and it appears to be rolling over. The 12-week correlation peaked at +0.7 in July and has already fallen to +0.12.
The last time it rolled over like this, in the summer of 2024, it went from +0.6 to -0.9 in about eight weeks. That was also the window in which AUD/JPY fell from 109 to 90. So, it is more likely than not that the relationship inverts again and returns to its historically negative regime. And if the 2024 sequence is any guide, that process may already be underway.
And if that happens, the BOJ will, yet again, have an excuse to pause its rate-hiking cycle.



Comments
Log in or sign up to join the conversation.