

(Click on image to enlarge)
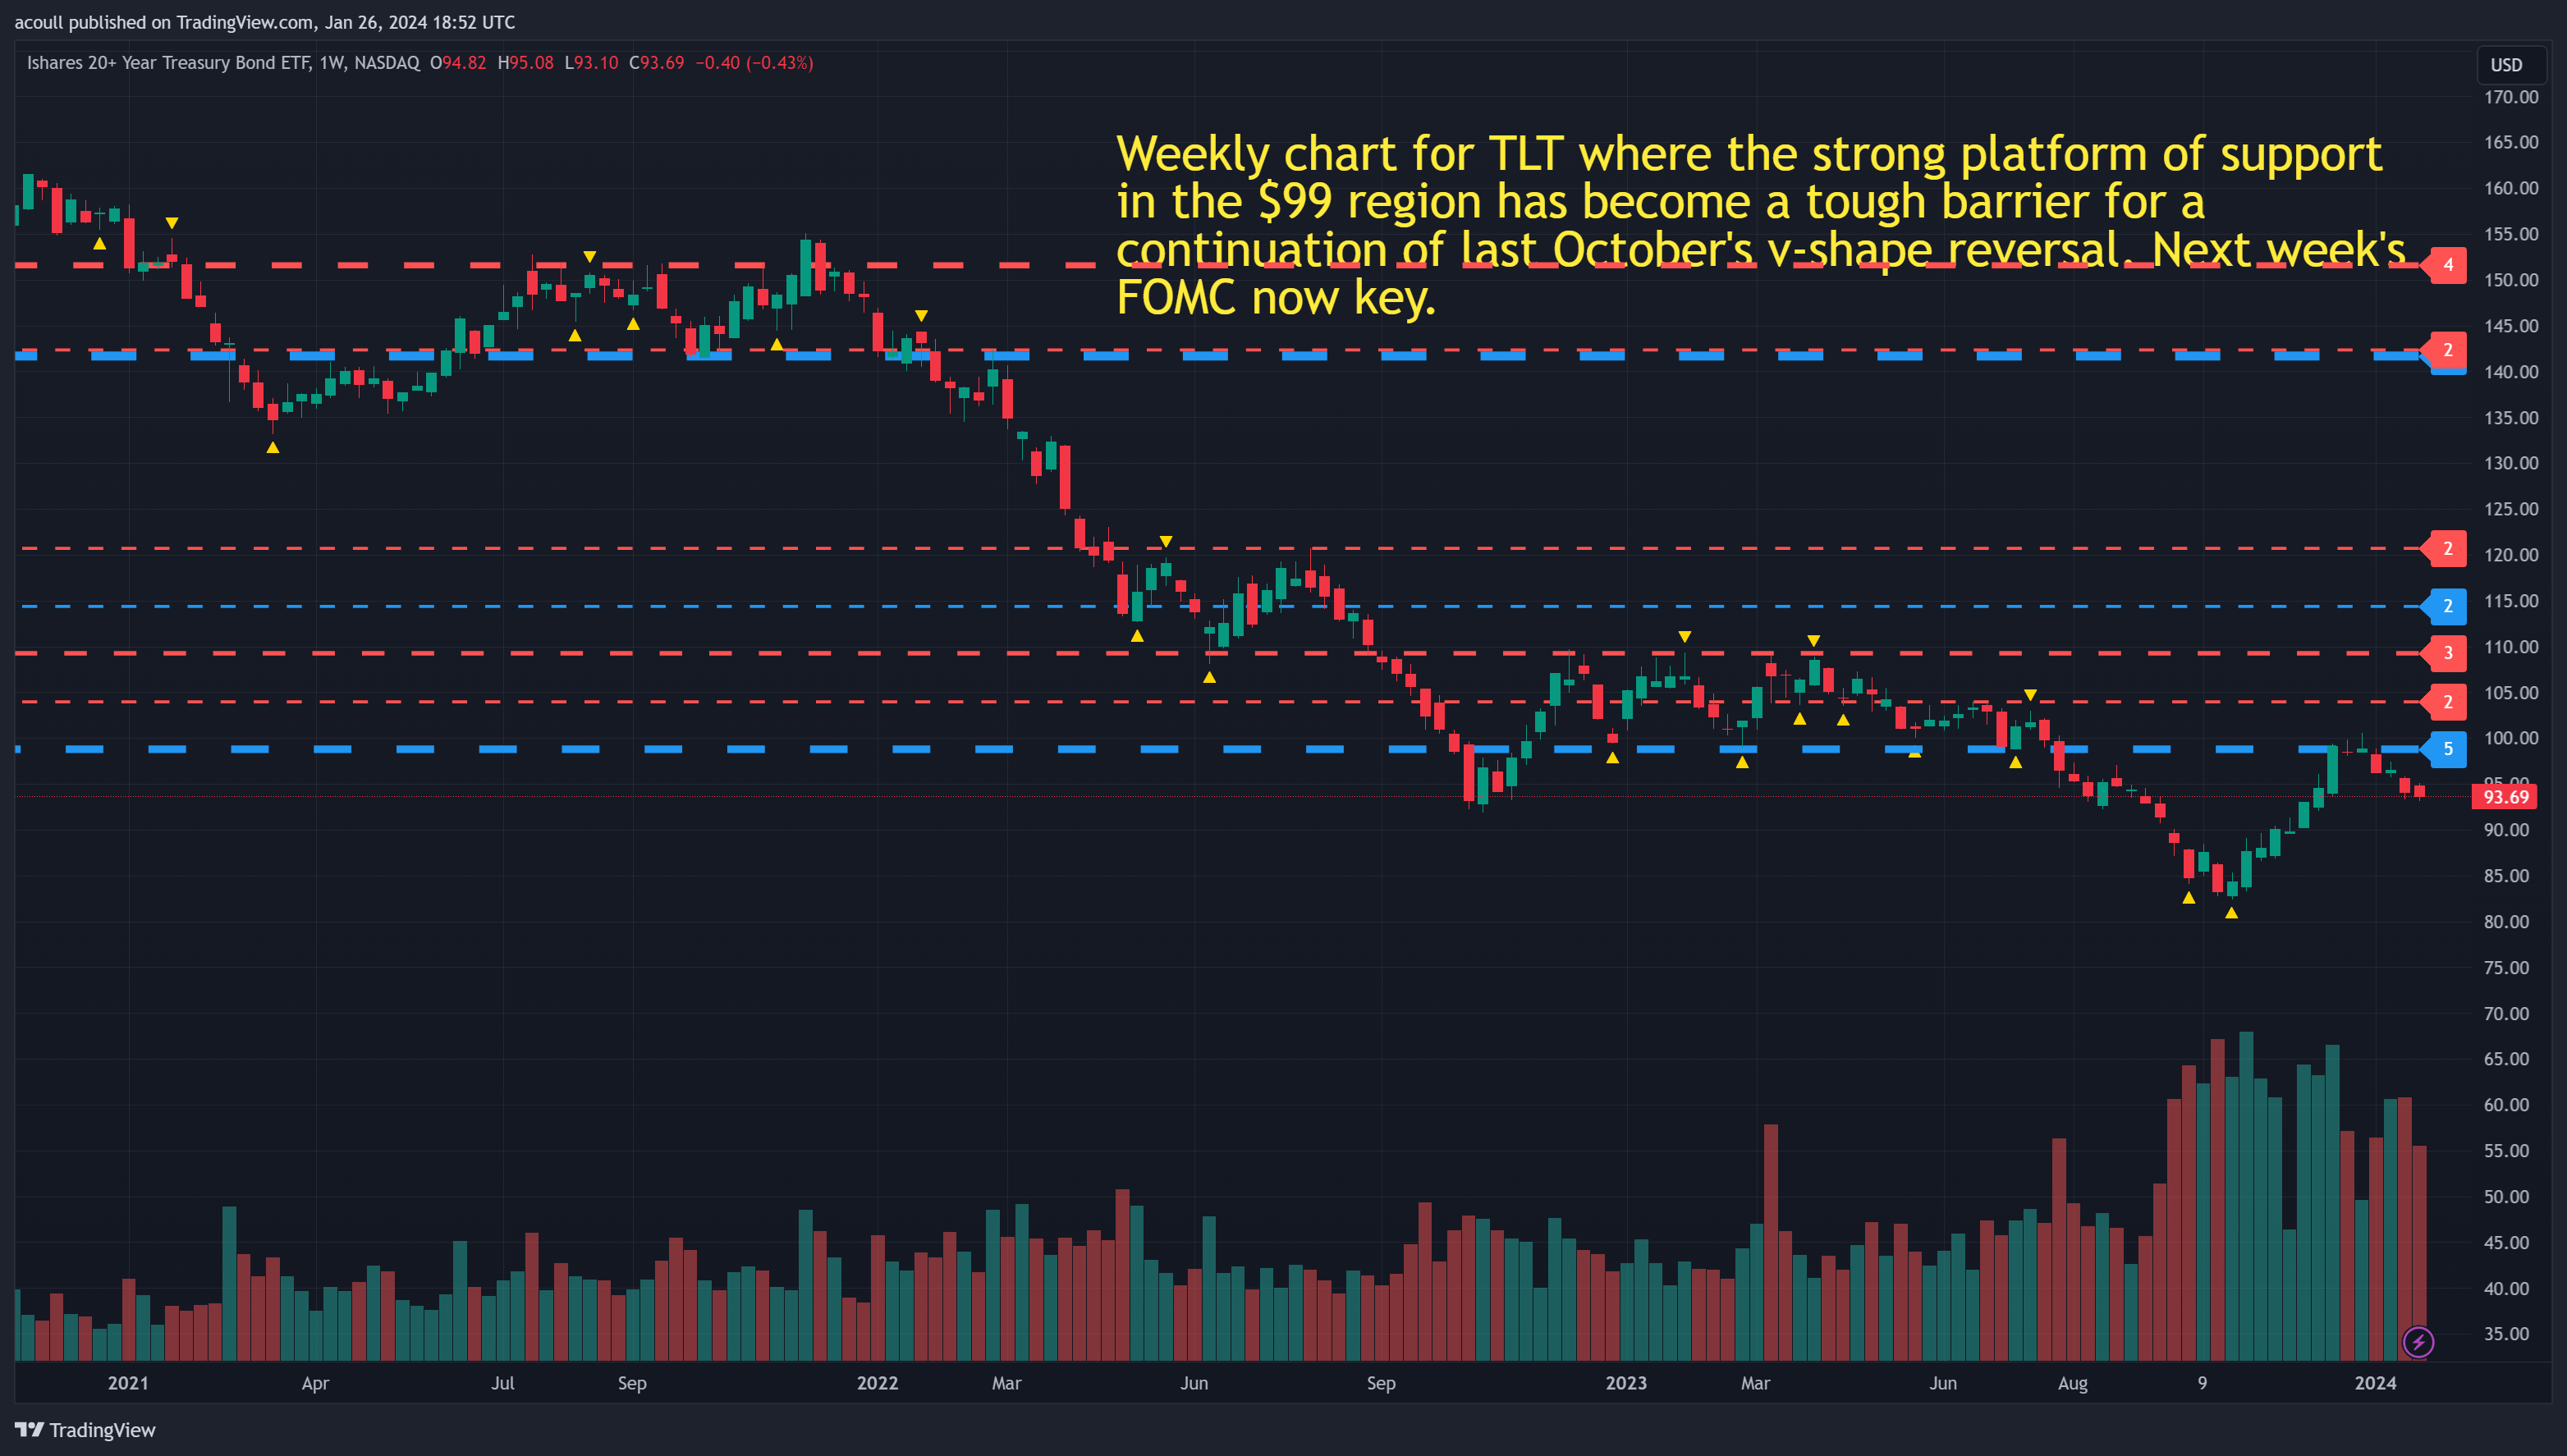
A while back, I uploaded a post on the TLT, which is an ETF that tracks the performance of long-term US Treasury Bonds. At the time, I considered the monthly chart and speculated whether TLT was at a turning point, given the stopping volume and buying we saw on the belief that yields would begin to fall. As a reminder, bond prices and yields are inverse. In other words, as bond prices fall, yields rise and vice-versa. As we can see on the weekly chart above, the ETF had been falling since January 22 following a break from the $140 support platform, and despite a retest of this level in March, it continued to move lower. The trend lower then continued with two failed rallies until TLT reached a low of $92, and a third attempt to rally developed into a congestion phase with TLT trading between $108 to the upside while building a support platform of support at the $99 region.
July 23 saw a break of this platform with TLT falling to a low of $82.42, but note the volume and very narrow spread down candles confirming heavy buying in the move lower before the V-shaped reversal on October 23, which, if you recall, coincided with a tweet for hedge fund billionaire Bill Ackman stating he had closed out his bond shorts. This added further volume & momentum to the move higher. However, just as support turns into resistance and vice-versa, the $99 region is now strong resistance. Whether TLT can resume the reversal will depend on interest rates, and next week’s FOMC may give us a clue.
More By This Author:
Where Next For The SPY?
Is The TLT At A Turning Point?
VPA Signs On The SPY


Comments
Log in or sign up to join the conversation.