

TSCO Tractor Supply Company
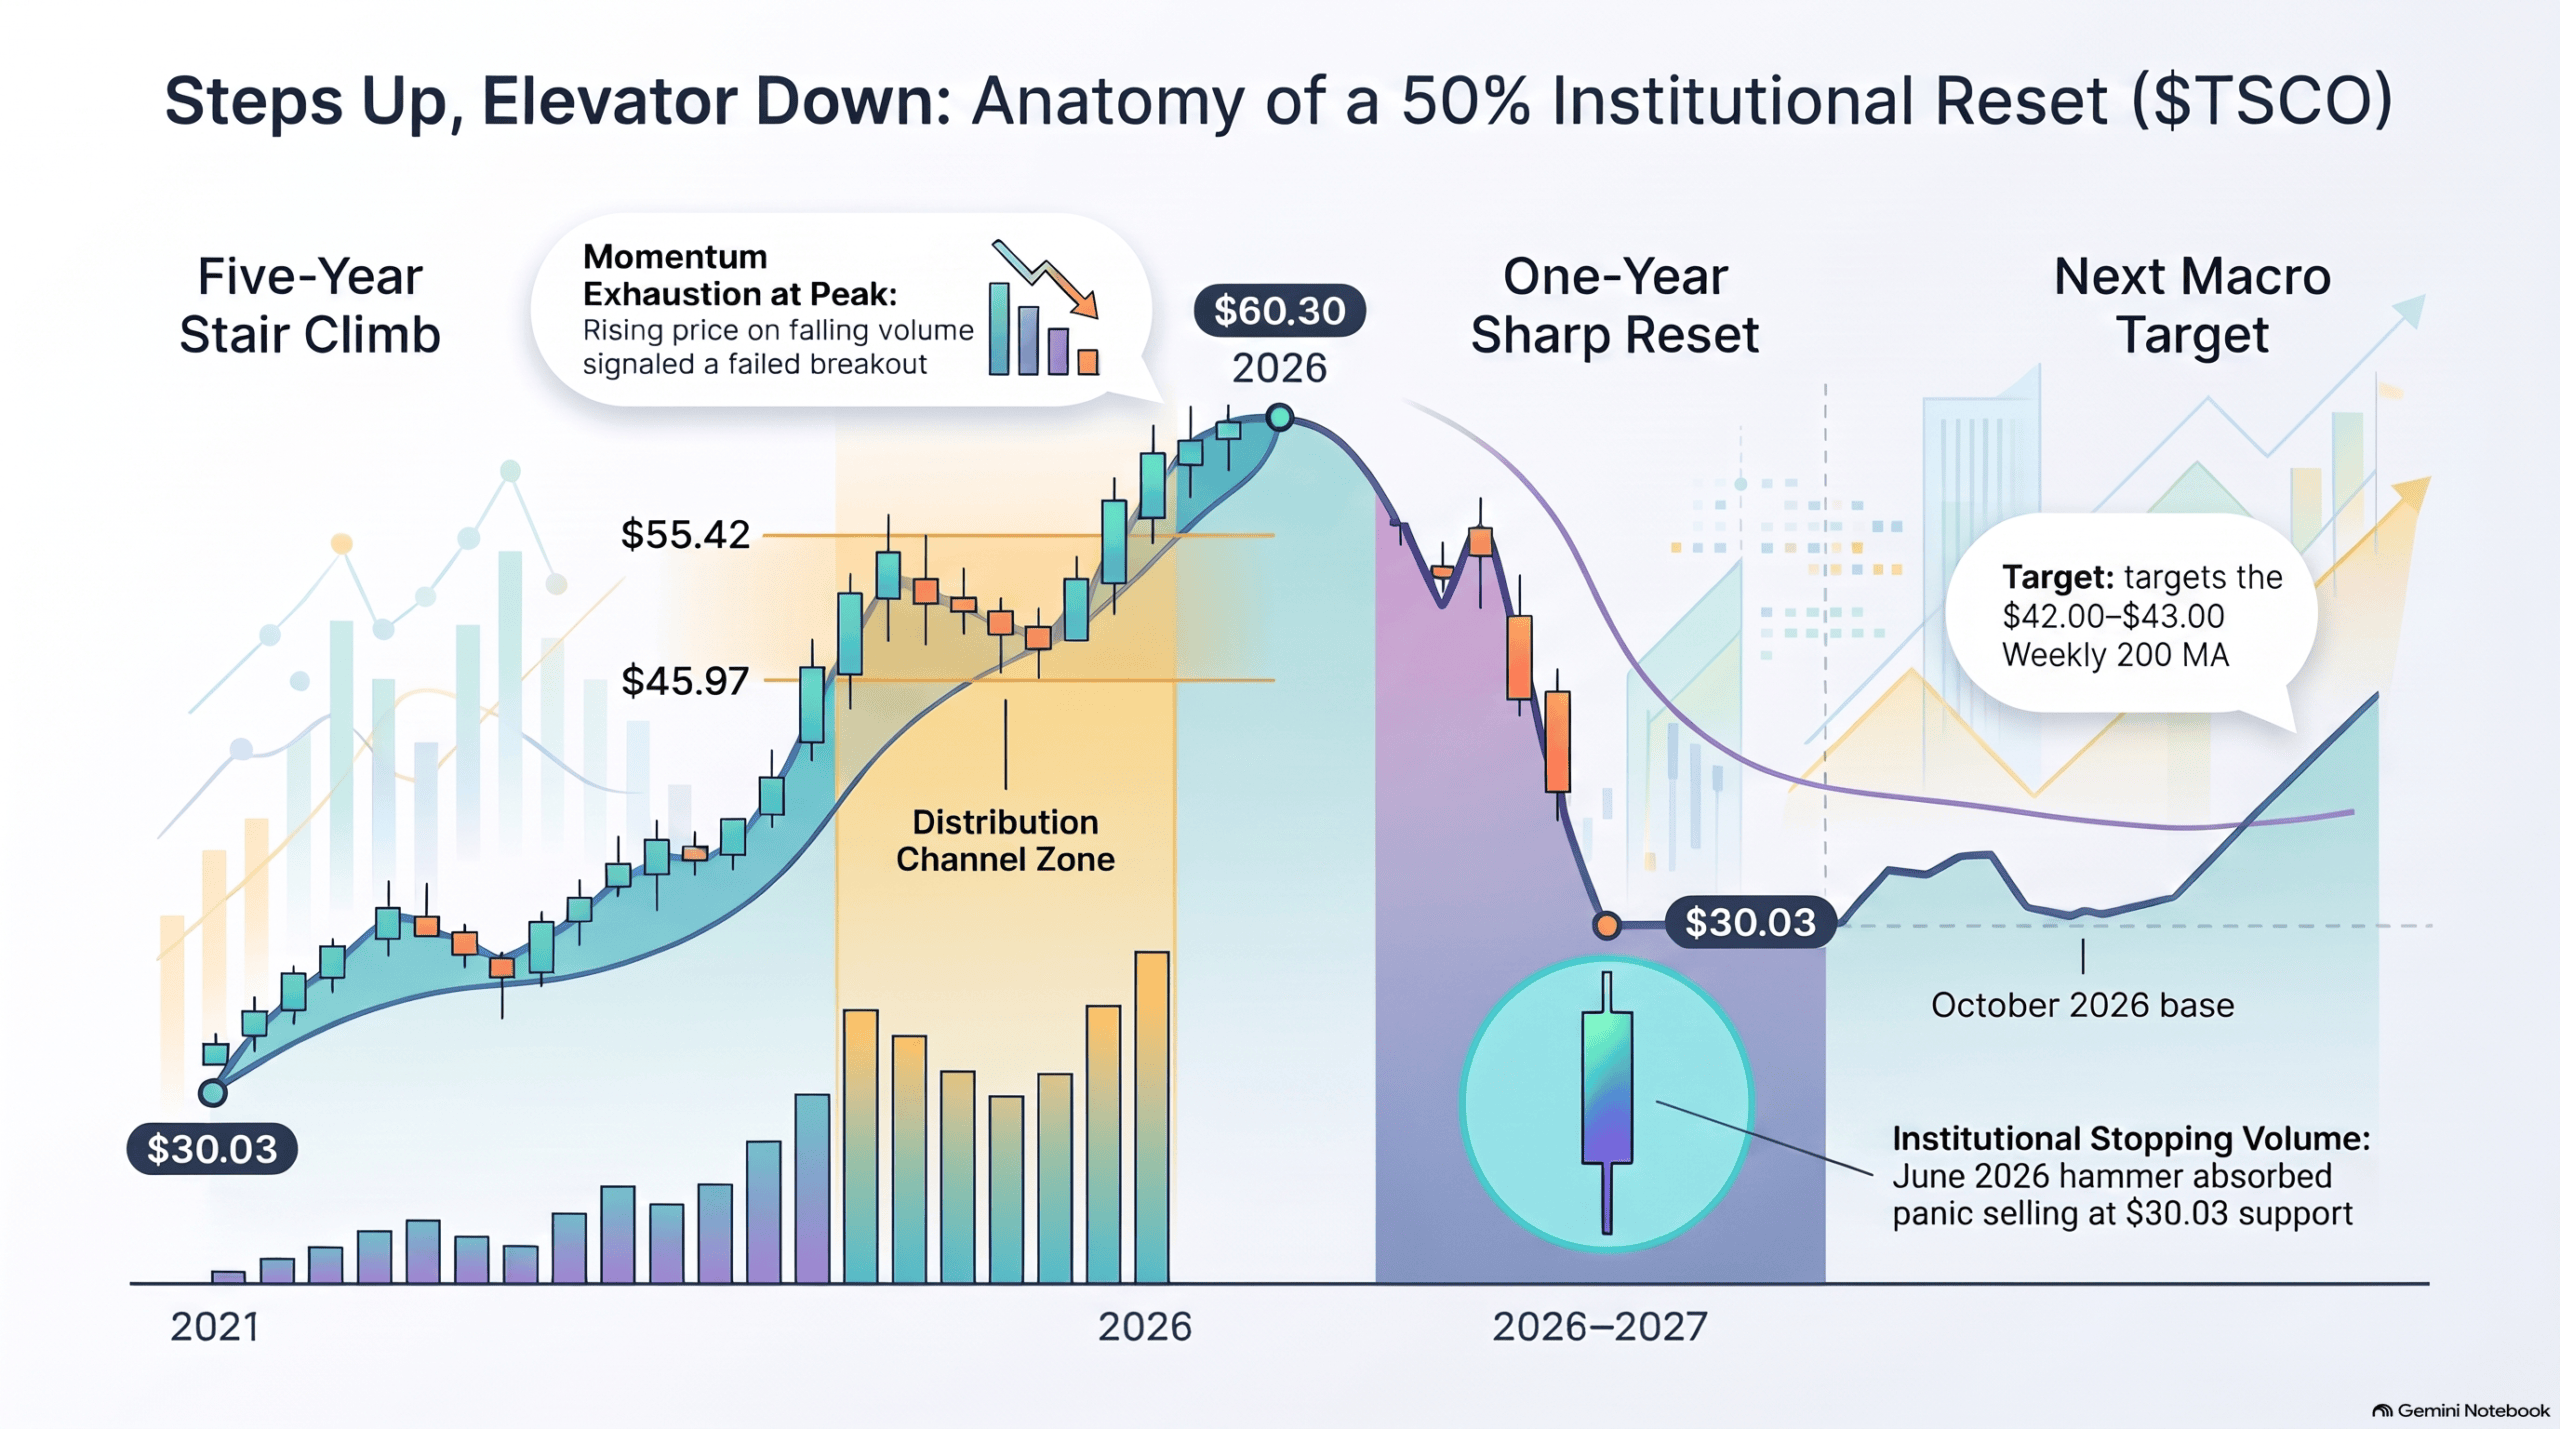
One of the oldest truths in the financial markets is that stocks take the stairs up and the elevator down. Tractor Supply Company (Nasdaq: TSCO) illustrates this axiom perfectly.
Over a five-year period from 2020 to 2025, TSCO climbed from $30.00 to a peak just above $60.00. This was fuelled by a combination of pandemic-era rural migration, backyard homesteading, and aggressive expansion into pet care and veterinary services. As a result, institutional investors bid the rural lifestyle retailer to premium valuations.
However, it took only twelve months for the elevator doors to open. As sales turned negative and profit margins compressed, management withdrew its long-term financial growth framework in mid-2026, wiping out five years of gains and driving the stock back down to the $30.00 macro floor.
To retail investors, a 50% drop in a low-beta retail stalwart looks like a broken business. To Volume Price Analysis (VPA) tape readers, however, the monthly chart and institutional order flow tell a story of textbook accumulation.
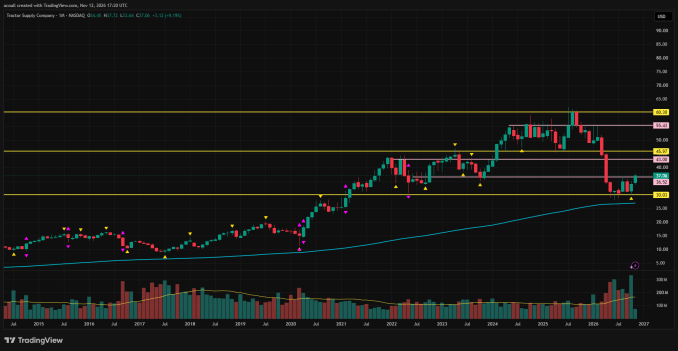
The Monthly VPA Autopsy: From Distribution Top to Stopping Volume Floor
If we take a close look at the monthly chart, every phase of TSCO’s rise, collapse, and recovery was telegraphed by the tape:
The Two-Year Distribution Box ($45.00 – $55.00): Throughout 2024 and 2025, TSCO traded inside a broad horizontal consolidation channel bounded by $45.97 on the bottom and $55.42 on the top.
The Failed $60.00 Breakout (Classic VPA Divergence): When the stock finally broke out of that box toward the $60.30 ceiling in late 2025, price rose on falling volume, resulting in an anomaly. As VPA traders, we understand Richard Wyckoff’s Law of Effort vs Result: rising prices on declining volume warn of momentum exhaustion, followed by a two-bar reversal at the highs that took TSCO back to the $45.97 floor.
The April 2026 Breakdown & May–June Stopping Volume: In April 2026, the $45.97 floor finally gave way, accelerating the drop into the $30.03 macro baseline (just above the rising Monthly 200 Moving Average). Crucially, the cascade stopped dead in May and June 2026. June printed a small-bodied hammer candle on the second-highest monthly volume in six years. Extreme volume on a narrow spread at a major horizontal floor is a classic signature of institutional stopping volume—large funds stepping in to absorb panic selling.
The Cooling Phase & October Base Confirmation: Moreover, whenever a stock expends that much energy over a short window, it must enter a quiet cooling period to absorb supply. TSCO spent the summer months consolidating calmly above $30.03, and October’s firm upward candle confirmed that a valid institutional base is now locked in.
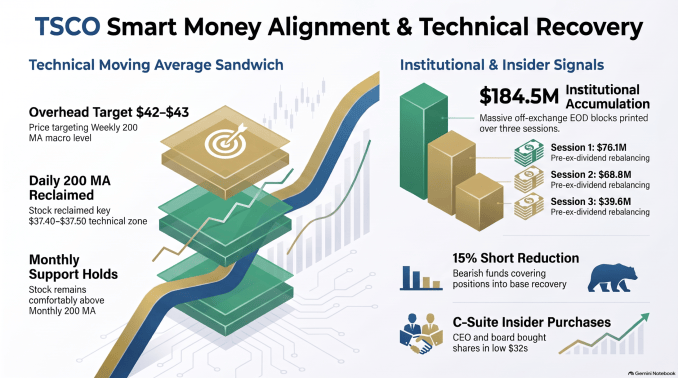
Multi-Timeframe Alignment & Off-Exchange Footprints
With TSCO now grinding higher off its $37.00 base, cross-referencing the higher timeframes with off-exchange institutional flow confirms that smart money is backing the recovery:
The Moving Average Sandwich: TSCO remains comfortably above its long-term Monthly 200 MA, has just reclaimed its Daily 200 MA (~$37.40–$37.50), and is now setting its sights on the intermediate macro level marked by the $42.00–$43.00 zone—precisely where the Weekly 200 Moving Average sits overhead.
$184.5 Million in Closing Auction Accumulation: Off-exchange institutional transaction data reveal large end-of-day positioning totalling $184.5 million across three consecutive sessions in early November ($76.1M, $68.8M, and $39.6M). Because TSCO is over 96% institutionally owned and these blocks printed directly as the stock reclaimed its Daily 200 MA ahead of its November 23 ex-dividend date, they point to deliberate institutional accumulation and benchmark rebalancing.
C-Suite Conviction & Short Covering: Reinforcing the tape, TSCO’s CEO and board members also stepped in with open-market share purchases in the low $32.00s, while short interest has dropped by 15% as bearish funds cover into the base.
Options Activity: Why TSCO Is Pausing at $37.00
If institutions have been accumulating so aggressively, why has TSCO paused at its Daily 200 MA? Options market data provide the exact mechanical answer.
The $37.00 Call Wall Pin: Positioning shows TSCO currently trading in a Positive Gamma regime (well above its $29.92 Gamma Flip line), with a Call Wall at $37.
Dealer Hedging Friction: Ahead of the November 23 ex-dividend date, call volume surged to over 97% of daily options flow (pushing the Option-to-Stock volume ratio to ~23%). Because market makers sold those calls, they are mechanically required to sell stock into minor rallies around $37.00–$37.50 to stay delta-neutral. This creates a temporary ceiling until the November monthly options expiration clears the gamma pin.
The Put Wall Floor: Meanwhile, the primary Put Wall sits at $33.00 (with November Max Pain at $33.50), establishing a floor just above the $30.03 monthly base.
The Key Levels to Watch
Tractor Supply shows how tracking big-money activity can separate a temporary dip in stock price from a company in real trouble.The 50% drop from $60.00 to $30.00 flushed out speculative excess, while the June stopping volume, October base confirmation, and $184.5M in closing auction blocks prove that long-term capital has rotated back in.
Primary Objective (Intermediate Macro Target): $42.00 – $43.00 (aligning with the intermediate pink resistance level and the Weekly 200 MA).
Current Gamma Pivot: $37.00 – $37.50 (Daily 200 MA and the November Call Wall).
Asymmetric Pullback Zone: $35.00 – $36.25 (above the $33.00 Put Wall and the CEO’s $32.15 insider purchase level).
Structural Invalidation: A firm monthly close below the $30.03 macro floor.
For both traders and investors, patience is key. Instead of chasing TSCO into the $37.00 gamma pin, watch for a low-volume consolidation or pullback to the $35.00–$36.25 shelf. Alternatively, wait for a clean post-expiration push through the Daily 200 MA to target the $42.00–$43.00 Weekly 200 MA.

Comments
Log in or sign up to join the conversation.