

"Taxes are what we pay for civilized society." - Oliver Wendell Holmes Jr.
"The art of taxation consists in so plucking the goose as to obtain the largest possible amount of feathers with the smallest possible amount of hissing." - Attributed to Jean-Baptiste Colbert
As I noted last week, less than 1/10 of 1% of all the political ads this midterm election even mentioned the debt. The Congressional Budget Office projects our current almost $41 trillion debt to grow to $46 trillion by 2030. And that’s with no new spending, just the laws on the current books.
To use a horseracing analogy, we are rounding the turn and entering the home stretch of what will become a major sovereign debt crisis. To get an understanding of what that means for us as individuals in the country, we need to understand how we got here. And what it will take to resolve the crisis. There are many factors that will come into play, and we will need to look at them all.
For the next several letters we are going to talk about money and taxes: how much the federal government collects, from whom, what it spends, and what it would take to keep the debt from swallowing us. I want to start with the part almost everyone has an opinion about and almost no one (except for my readers!) has examined closely. Who actually pays the taxes in this country?
In fiscal year 2026, which ended September 30, Washington took in $5.4 trillion and spent $7.4 trillion. The deficit was just under $2 trillion. That is about 6.2% of GDP, and net interest on the debt crossed $1 trillion for the first time, about $1.1 trillion depending on how you count it, which is more than we spend on defense. Debt held by the public is now roughly 100% of GDP and approximately $33 trillion. Including debt that we “owe to ourselves” total US debt is about 123% and roughly $41 trillion.
We are not in a recession. Unemployment is low. Even with all the volatility, the overall stock market is near all-time highs. Interest rates have risen back to pre-GFC levels. This is what "normal" looks like now.
Over the course of this series, I am going to argue that the way out is to get the deficit below the growth rate of nominal GDP, so that the debt shrinks relative to the size of the economy. Do that, and we can grow our way out over time. Shrink the deficit further and we get there faster. In later letters we will get precise about what that target means. For now, just hold onto the idea that the gap we have to close is something like $1 trillion a year and growing, even though total deficits are in the $2 trillion range.
So how do we get there? You can either increase taxes, cut spending or a combination of both. That’s it. So how do we do it?
Whenever this subject comes up, there are many who say the answer is simple: tax the rich. It is a great slogan. It polls well. And I want to be fair about it, because there is a real case that people at the top can pay more. But slogans are not arithmetic. Before we can talk about how much more anyone should pay, we need to know who is paying now, and how much. That is what this letter is about. Next week, or perhaps the week after, we will ask the harder question: if we tried to close the gap with tax increases alone, how high would rates have to go, and what would that do to the economy?
Fair warning: there are a lot of tables and charts in this one. I think you will find some of them surprising. I certainly did.
Why We Pay Taxes at All
Justice Holmes had it right. You cannot have courts, roads, a navy, or a functioning currency without paying for them. Except for anarchists on both sides of the political spectrum, even the most ardent small-government libertarians I know (and I know a few) agree that some taxes are necessary. The argument is never really about whether, but about how much, on whom, and for what.
Adam Smith laid out four principles of taxation in 1776 that still hold up well. Taxes should be proportioned to people's ability to pay. They should be certain rather than arbitrary, so people know what they owe. They should be collected at a time and in a way convenient to the taxpayer. And they should take as little as possible out of people's pockets beyond what actually reaches the treasury. Notice that last point. Smith understood that a tax can cost the economy far more than it brings in, by discouraging the very activity it taxes. Hold that thought. It is the whole ballgame when we get to "tax the rich."
Colbert's goose is the cynical version of the same insight. Politicians want feathers without hissing. That is why so much of our tax system is either invisible (withholding, payroll taxes split with the employer, corporate taxes, tariffs) or aimed at someone else. The tax that is easiest to pass is the one somebody else pays.
A Short History of the Income Tax
The United States got along without a permanent income tax for most of its first 125 years. Lincoln imposed one to pay for the Civil War, and it was repealed in 1872. Congress tried again in 1894, and the Supreme Court struck it down the following year. That is why it took a constitutional amendment. The 16th Amendment was ratified in February 1913, and the Revenue Act of 1913 followed that October.
The original tax was tiny by today's standards. There was a 1% "normal" tax on income above a $3,000 exemption ($4,000 for married couples), plus surtaxes that topped out at 6% on income over $500,000, for a top rate of 7%. That $3,000 is now $102,000 in today’s inflation-adjusted money. $500,000 is now $17 million.
That income levels kept the vast majority of Americans out of the tax entirely. Fewer than 400,000 returns were filed for 1913, in a country of nearly 100 million people. The tax raised about $28 million that first partial year. Under the 1913 law, they would pay no income tax today. 23% of income earners, and 41% of households make income of $100,000. (Census Bureau data. Different government sources will yield somewhat different numbers.)
The original income tax was, quite deliberately, a tax on the rich.
Then came the wars. World War I took the top rate to 77% by 1918. The Mellon tax cuts of the 1920s brought it back down to 25%. The Depression pushed it up again, to 63% in 1932 and 79% by 1936. World War II pushed it to its all-time peak of 94% in 1944. More important than the top rate, though, was what happened to everyone else. To pay for the war, Congress slashed the exemption and introduced payroll withholding. The income tax went from a "class tax" to a "mass tax." The number of Americans paying it went from 3.9 million in 1939 to 42.6 million in 1945. That, not the 94% rate, is what made the income tax the workhorse of federal finance.
The top rate stayed at 91% or 92% through the 1950s and early 1960s. The Kennedy tax cut, enacted under Johnson in 1964, took it to 77% and then 70%. Reagan cut it to 50% in 1982 and the 1986 tax reform took it to 28%. Since then, it has bounced between 31% and 39.6%. The 2017 Tax Cuts and Jobs Act set it at 37%, and last year's One Big Beautiful Bill Act made the TCJA rates permanent.
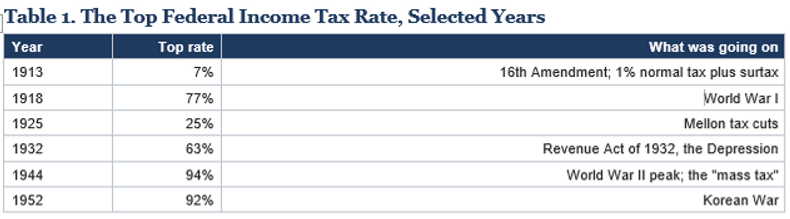
Source: Tax Policy Center, Historical Highest Marginal Income Tax Rates (from IRS Revenue Procedures); Mauldin Economics, John Mauldin.
Now here is the chart I want you to stare at for a minute. The red line is the top income tax rate. The blue line is what the individual income tax actually collected, as a share of the economy.
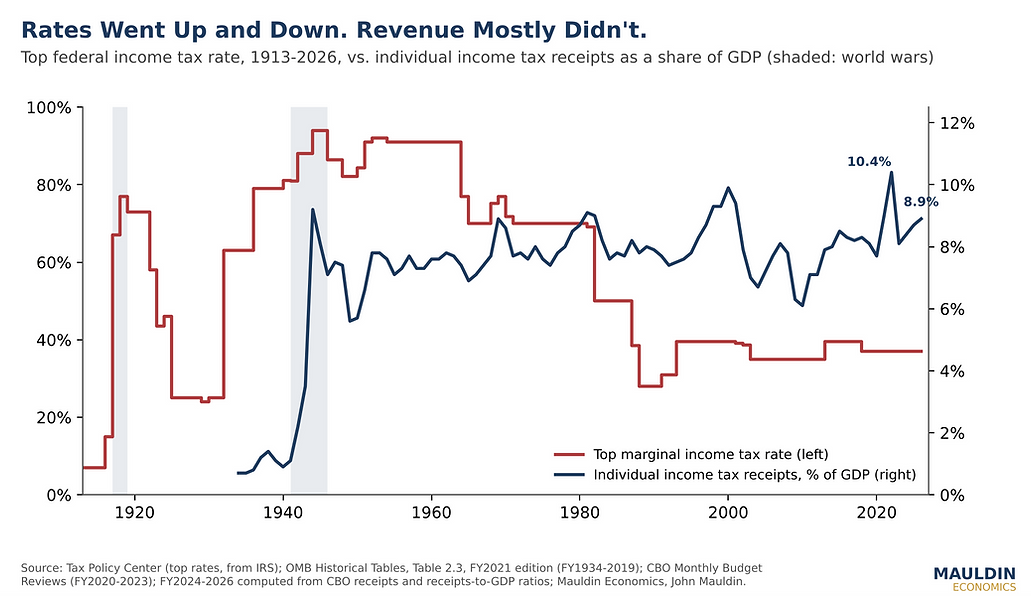
Figure 1. The top rate swung between 28% and 94%. Revenue from the income tax barely noticed.
After World War II, the top rate swung from 91% down to 28% and back up to the high 30s. Yet individual income tax receipts mostly stayed in a band of about 7% to 10% of GDP. In 2022, with a top rate of 37%, the income tax brought in 10.5% of GDP, the highest on record. In fiscal 2026 it was about 8.9%. Economists argue about why (deductions, shelters, how much income was actually taxed at those top rates, changes in when people choose to realize gains), and they argue in good faith. But the pattern itself is hard to dispute. Statutory rates are a poor guide to revenue.
And here is a second chart that surprises nearly everyone. As top rates came down, the share of income taxes paid by the top 1% went up, not down. In 1980, when the top rate was 70%, the top 1% paid 19.3% of all federal income taxes. In 2023, with a top rate of 37%, they paid 38.4%. Part of that is because the top 1% earns a much larger share of income than it did in 1980, and critics are right to point that out. Part of it is that lower rates brought income out of shelters and onto tax returns. Either way, the idea that the rich pay less of the bill than they used to is simply not what the data show.
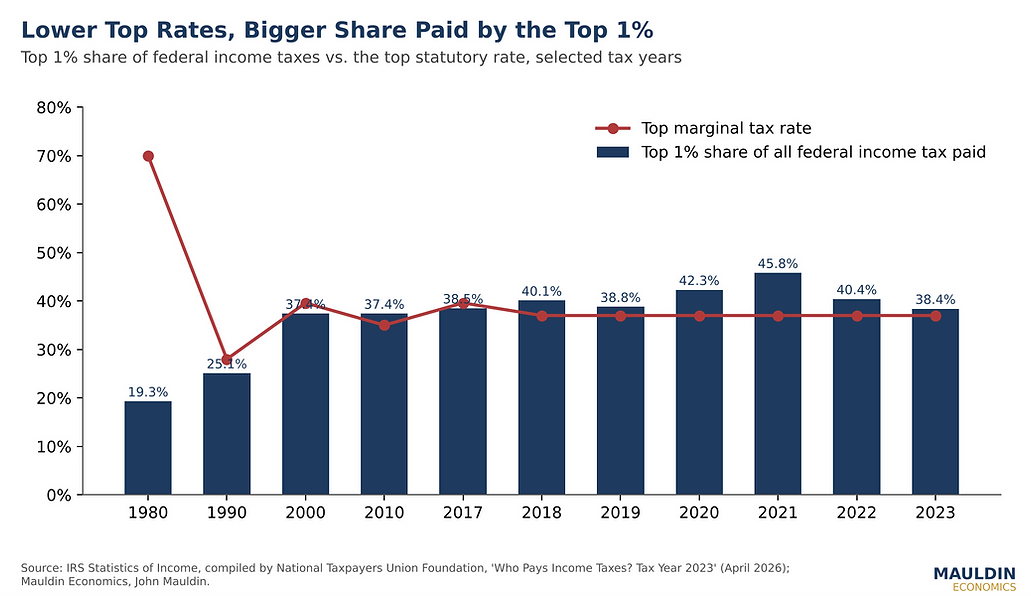
Figure 2. Top 1% share of federal income taxes vs. the top rate.
What Taxes We Pay Today
Let's look at where the $5.4 trillion came from in fiscal 2026.
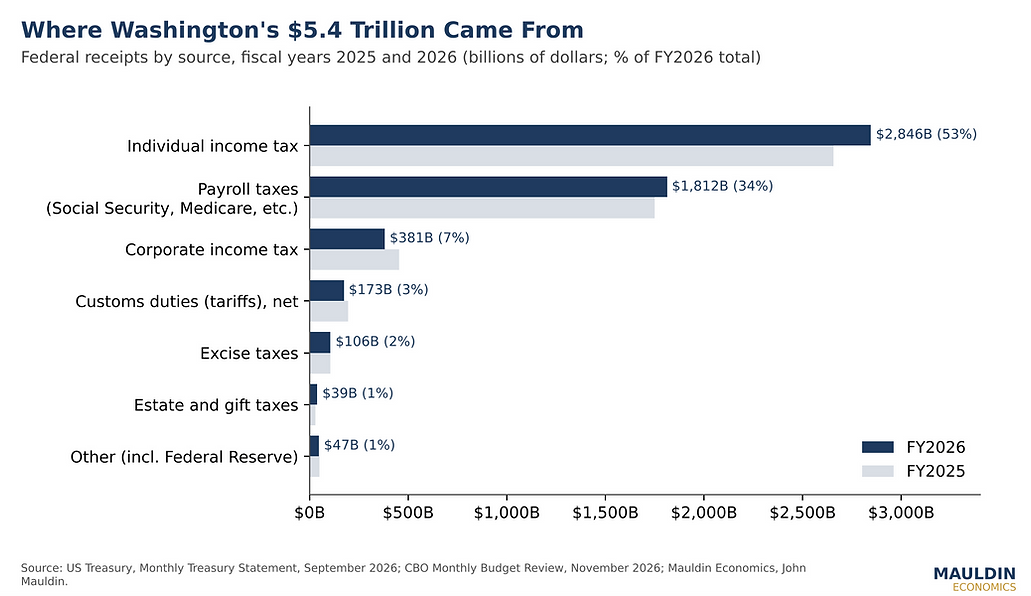
Figure 3. Federal receipts by source, FY2025 and FY2026.
A quick tour of the major pieces:
The individual income tax ($2.85 trillion, 53% of the total). Seven brackets from 10% to 37%, now permanent. Long-term capital gains and qualified dividends are taxed at 0%, 15% or 20%, plus a 3.8% surtax on investment income at higher incomes.
Payroll taxes ($1.81 trillion, 34%). Social Security takes 6.2% from the worker and 6.2% from the employer on wages up to $184,500 in 2026. Medicare takes 1.45% from each on all wages, plus an extra 0.9% on high earners. For most working Americans, this is a bigger tax bill than the income tax.
The corporate income tax ($381 billion, 7%). A flat 21% since 2018. More on this below.
Customs duties, meaning tariffs ($173 billion net). Treasury actually collected about $318 billion in gross customs receipts in fiscal 2026, but paid out nearly $145 billion in refunds, largely because the Supreme Court ruled in February that the IEEPA tariffs were unlawful. We will give tariffs their own letter. For now, note that they are real money but not a large share of the total, and that the courts have just shown how quickly the number can change.
Excise taxes ($106 billion). Gasoline, tobacco, alcohol, airline tickets and so on.
Estate and gift taxes ($39 billion). A 40% rate, but only on estates above $15 million per person ($30 million for a couple) starting this year. Lots of political heat (hissing), very little revenue (feathers).
Put the first two together and you have the main story. Individual income and payroll taxes are 86% of federal revenue. If we are going to raise substantially more money from taxes, that is where it will have to come from, because that is where the money is.
Who Pays the Income Tax
Now to the heart of the matter. The IRS publishes remarkably detailed data on who pays the income tax, but it takes about two and a half years to finalize it. The latest complete year is 2023. In 2023 there were 153.1 million income tax returns (excluding dependents) reporting $15.2 trillion of adjusted gross income (AGI) and paying $2.14 trillion of federal income tax, an average rate of 14.1%.
One technical point before the tables. The IRS counts returns, not people. A married couple filing jointly is one return. So, when I say the top 1% is 1.53 million returns, that represents more than 1.53 million people, probably closer to three million when you count spouses. With that caveat, let's start at the very top and work down.
Inside the Top 1%
Let’s put the top 1% under a microscope. The first table shows each slice on its own, so nobody is counted twice. The top 0.001% is its own row; the next row is everyone from the 0.001% line down to the 0.01% line; and so on.
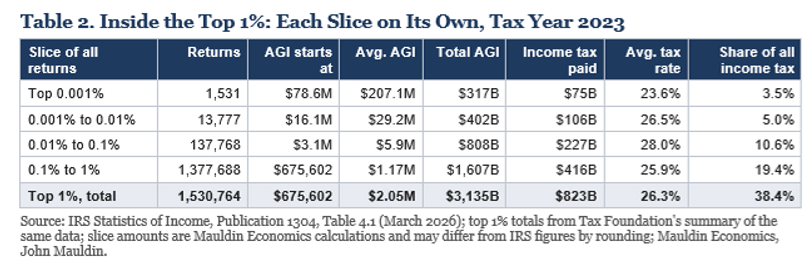
Let that sink in. About 1,500 returns, a group that could fit in a high school gymnasium, paid $75 billion, 3.5% of all federal income taxes. Average income in that group was over $200 million. And the next 13,777 returns paid another $106 billion.
I wanted to include a top 0.5% row as well. The IRS does not publish that cut; its percentile tables jump from the top 0.1% to the top 1%, then to the top 2%. Rather than make up a number, I have left it out.
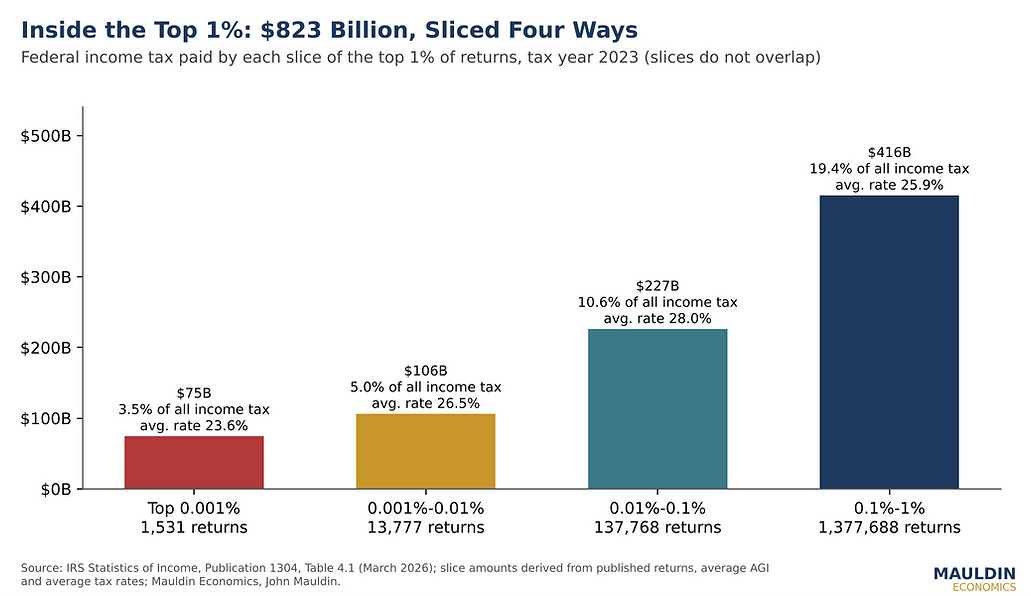
Figure 4. Federal income tax paid by each slice of the top 1%.
Notice something odd in the average tax rates. The very top, the 0.001%, pays a lower average rate (23.6%) than the slices just below it (26.5% and 28.0%). That is not because billionaires have secret loopholes the rest of us lack. It is mostly because a much larger share of their income is long-term capital gains and dividends, which are taxed at lower rates than wages. The current capital gains tax rate is 20%, +3.8% net investment tax for an effective total of 23.8% for high earners. Whether that is good policy is a fair debate, and we will have it. But it tells you something important about "tax the rich": the income at the very top is mostly capital income, and capital income is the most mobile, most deferrable, most easily rearranged income there is.
Here is the same data stacked up the way most people see it, cumulatively from the top:
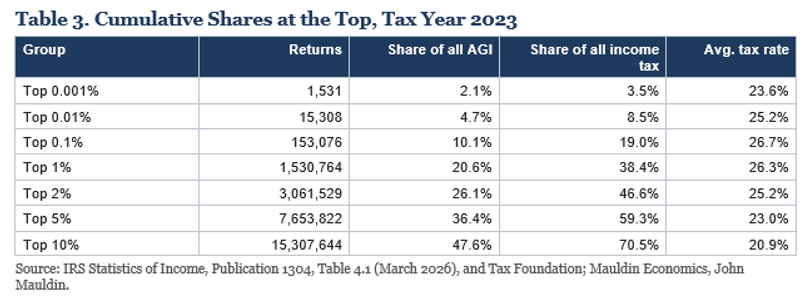
The top 0.1%, about 153,000 returns, reported a tenth of all adjusted gross income and paid nearly a fifth of all income taxes. The top 1% earned about a fifth of all AGI and paid nearly two-fifths of the tax. The top 10% paid more than 70%.
Everyone Else
Now let's walk down the rest of the distribution. Again, each row stands alone.
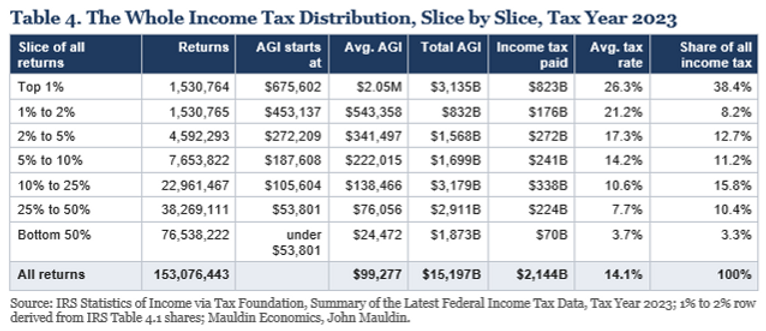
A few things jump out. The bottom half of all returns, 76.5 million of them, paid $70 billion between them, about $913 per return on average, or 3.3% of the total. Roughly 49 million filers, about 30.5%, owed no federal income tax at all in 2023. Meanwhile the 1.5 million returns in the top 1% paid more income tax than the bottom 90% combined.
The IRS does not publish the income tax data in clean deciles; it reports the top 10%, 25% and 50%, which is why the bands in Table 4 widen as we go down. For a decile-style picture that includes payroll taxes and what people receive back from the government, we need a different source, which is where we go next.
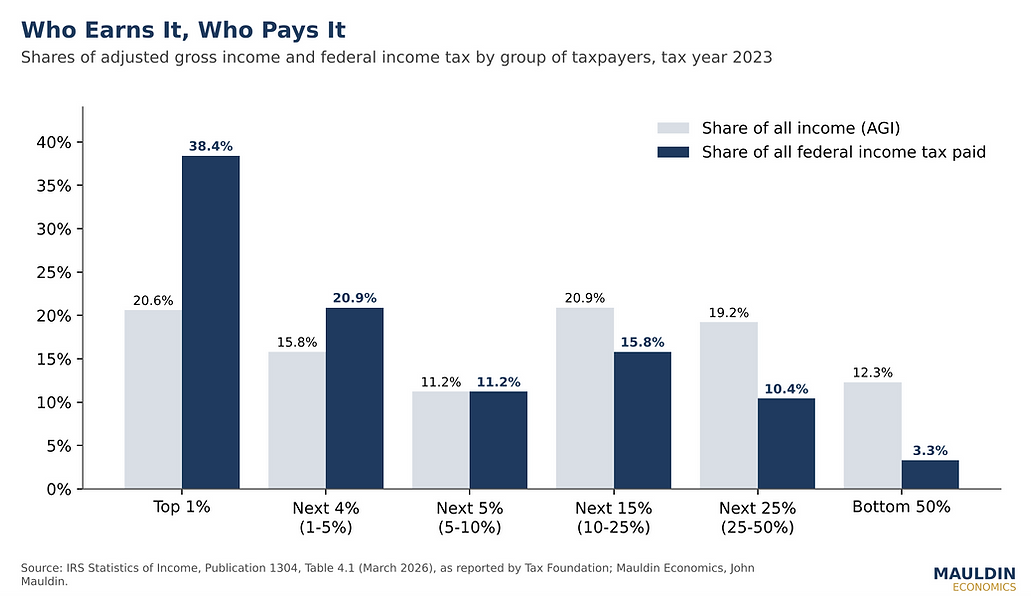
Figure 5. Share of income vs. share of income tax paid.
Who Pays All Federal Taxes, and Who Gets Help
The income tax is only half the story. A worker earning $45,000 may owe little or no income tax but still pays 7.65% in payroll taxes, and the employer pays another 7.65% that economists generally believe comes out of the worker's wages. On the other side of the ledger, many lower-income households receive more in government benefits than they pay in taxes.
The Congressional Budget Office pulls all of that together. Its latest report covers 2023 and looks at roughly 134 million households, sorted into fifths by income. It counts all federal taxes (income, payroll, corporate and excise taxes, allocated to households) and adds means-tested transfers: Medicaid and CHIP, SNAP, Supplemental Security Income, and the refundable portion of tax credits.
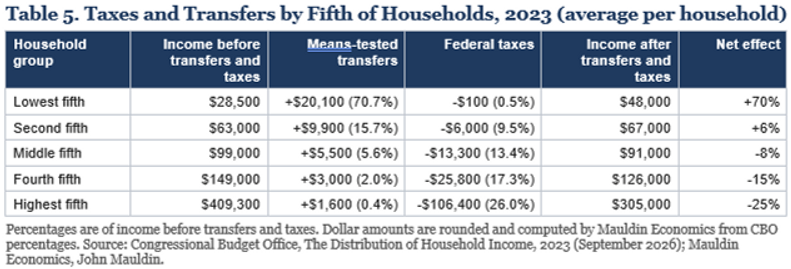
The lowest fifth of households had average market income of about $28,500 and ended up with about $48,000 after transfers and taxes. The highest fifth went from about $409,000 to about $305,000. The middle fifth is roughly a wash, slightly negative. In CBO's accounting, the top fifth paid 70% of all federal taxes and the top 1% paid 26%. (The top 1% share is lower here than in the income tax tables because CBO counts payroll taxes, which fall more heavily on the middle, and because it measures households rather than tax returns.)
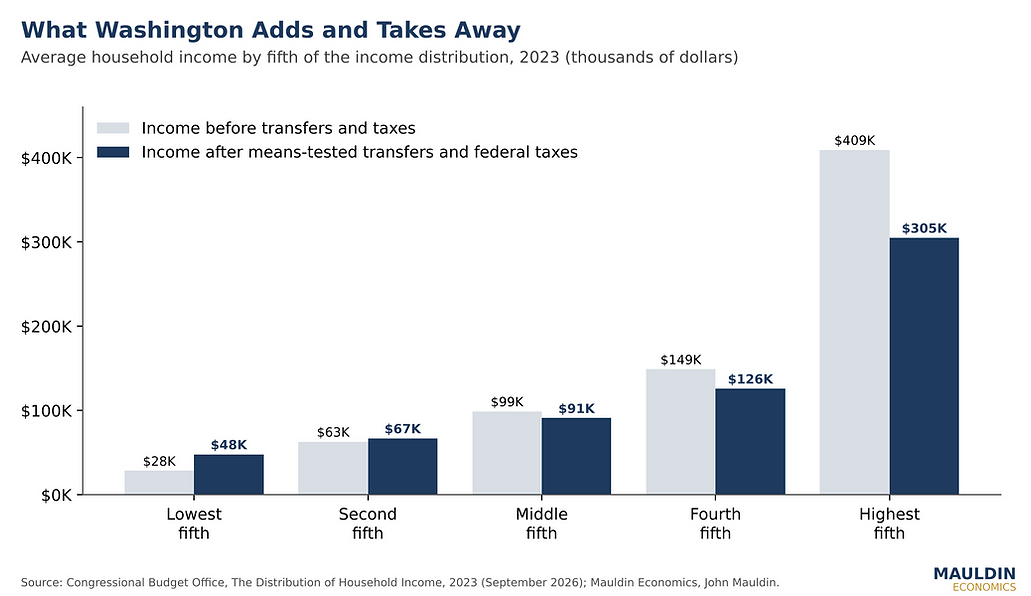
Figure 6. Household income before and after means-tested transfers and federal taxes, 2023.
Two caveats, both important. First, CBO counts Social Security and Medicare benefits as part of income before transfers, not as transfers, on the theory that people paid for them through payroll taxes. If you treated those benefits as transfers, the lower and middle fifths, which include most retirees, would look far more subsidized. Second, Medicaid is valued at what the government spends, which for the lowest fifth is a very large number: Medicaid and CHIP alone equal about 48% of that group's market income. Reasonable people can argue about whether a dollar of Medicaid spending is worth a dollar of cash to the recipient. Either way, it is a dollar of federal spending.
This is the honest picture. The federal system is highly progressive on both sides: the top pays most of the taxes, and the bottom receives most of the transfers. Anyone who tells you otherwise has not looked at the government's own numbers.



Comments
Log in or sign up to join the conversation.