


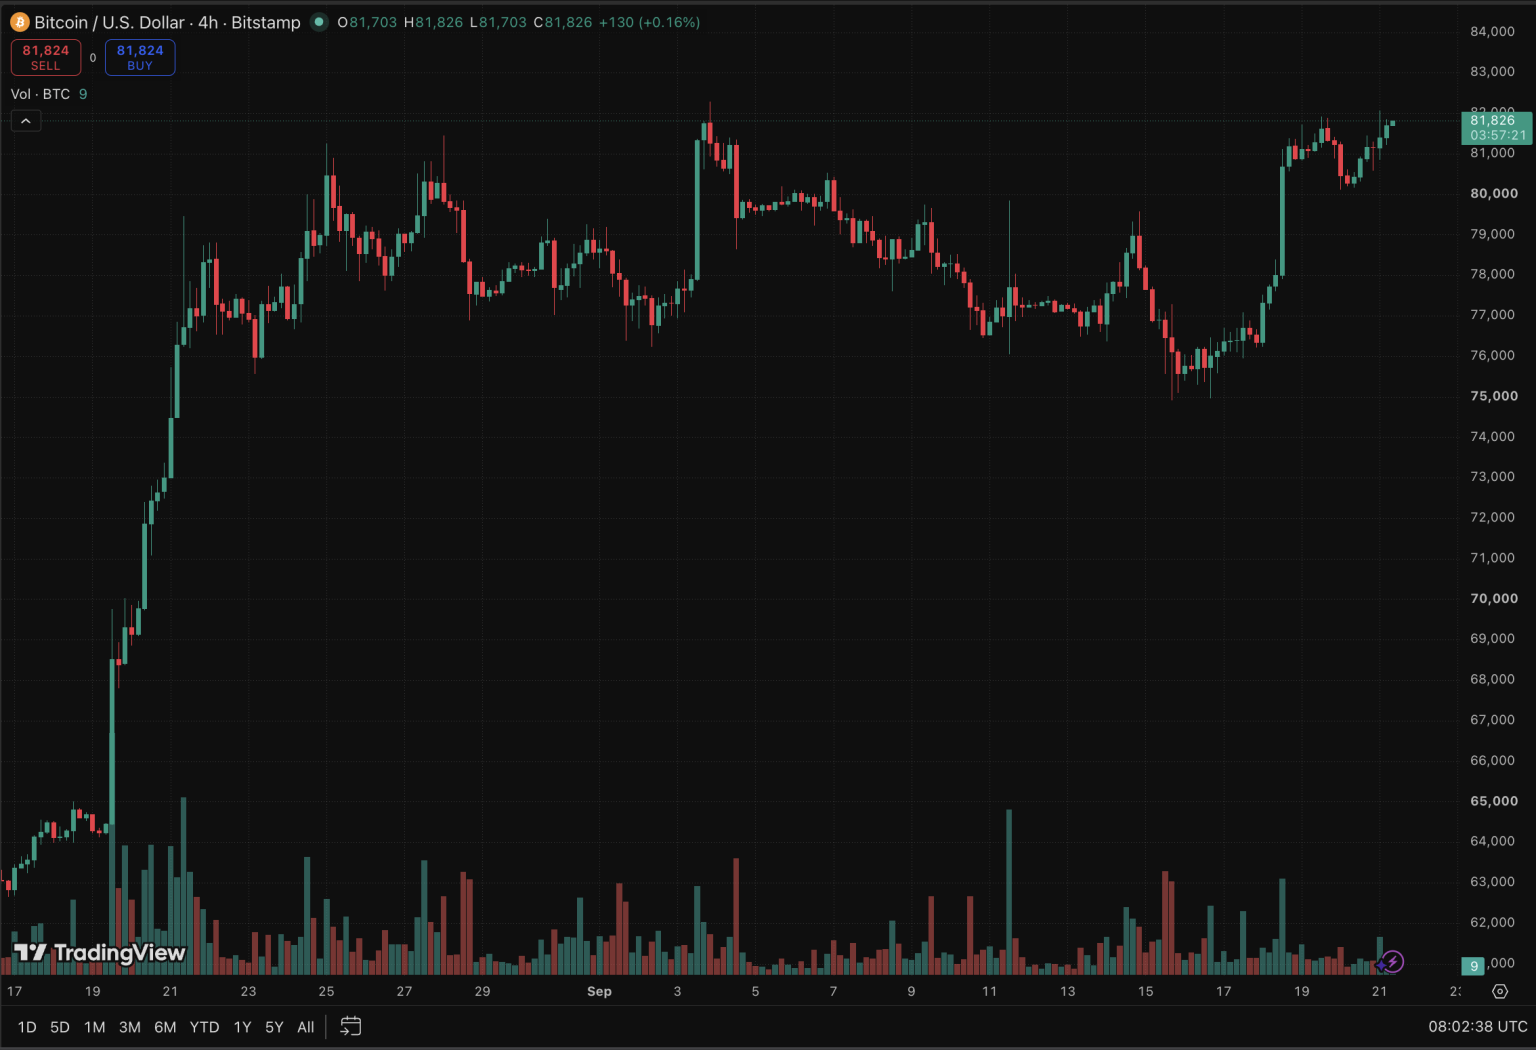
Bitcoin closed the week ended September 20 above its 50-week moving average for the first time in 45 weeks, trading near $81,600 after gaining almost +1.5% over the week and +20% over the previous 35 days, according to CoinGecko data.
The moving average itself sits near $78,115, putting Bitcoin above a long-term trend line that had acted as a barrier during the decline.
That distinction, a weekly close above the average rather than a fleeting intraday move through it, is central to the technical case, and multiple analysts are all in agreement.
Galaxy Research found that Bitcoin avoided setting a new low after 11 of 13 previous weekly moves back above the 50-week average. The immediate question is whether Bitcoin can remain above the level long enough for the former resistance area to act as support.
Why the 50-Week Moving Average for Bitcoin Matters
The 50-week moving average calculates the average weekly closing price over the past year and indicates Bitcoin’s long-term trend. During price increases, Bitcoin typically trades above this average, while during declines, rally attempts often fail below it.
Galaxy Research views this average as a ceiling during drawdowns; once Bitcoin drops below it, recovery attempts usually fail until it reaches a market low. Conversely, successfully closing above the average has historically marked the end of bear markets, followed by significant price rallies.
The timing of the weekly close is crucial, with Bitcoin’s candlestick closing at 23:59 UTC on Sundays. Analysts prioritize weekly or daily closes over major moving averages, as brief intraweek gains can reverse before the candle closes.
On September 20, Bitcoin’s weekly candlestick closed above its 50-week average, drawing attention as a significant trend signal, as Galaxy Research has noted in past Bitcoin downturns.
Historical Bullish Precedent
Galaxy Research analyzed major Bitcoin declines since 2011 and identified 13 instances where Bitcoin closed a week above its 50-week moving average. In 11 of these cases, the market did not set a new low afterward, suggesting that the worst of the decline had often passed.
Historical rallies following such crossovers have been significant: after the 2011 crash, Bitcoin rose from around $2 to nearly $1,200, and after the 2014 bear market, it rallied from about $200 to nearly $20,000 by late 2017.
Following the 2018 crash, a rebound in May 2019 led to a rise from around $3,200 to over $69,000 by late 2021. Most recently, after crossing above the average in March 2023, Bitcoin surged from about $15,500 to a high of about $126,000 by October 2025.
These examples illustrate potential rally scales rather than implying causation from the moving average signal, which should be viewed as one of several indicators rather than a standalone explanation for market trends.
The False-Signal Risk
History does not guarantee outcomes, and historical reclaims have failed. Of the 13 identified by Galaxy Research, two did not hold: the crossovers on Dec. 26, 2021, and March 27, 2022, when Bitcoin briefly exceeded the average before declining toward $16,000.
These instances show that a single weekly close above the moving average doesn’t confirm the end of a bear market; subsequent price action matters.
Currently, the latest reclaim suggests that the bear-market low may have been set around $60,000. The key test now is whether Bitcoin can stay above the moving average of approximately $78,115 in the coming weeks.
According to Bitget data, the weekly close was near $81,159, compared with a 50-week average of about $78,788, reflecting differences across data sources, though both indicate a close above the average.



Comments
Log in or sign up to join the conversation.