

WEI and WECI, for data releases through 10/11/2025:
(Click on image to enlarge)
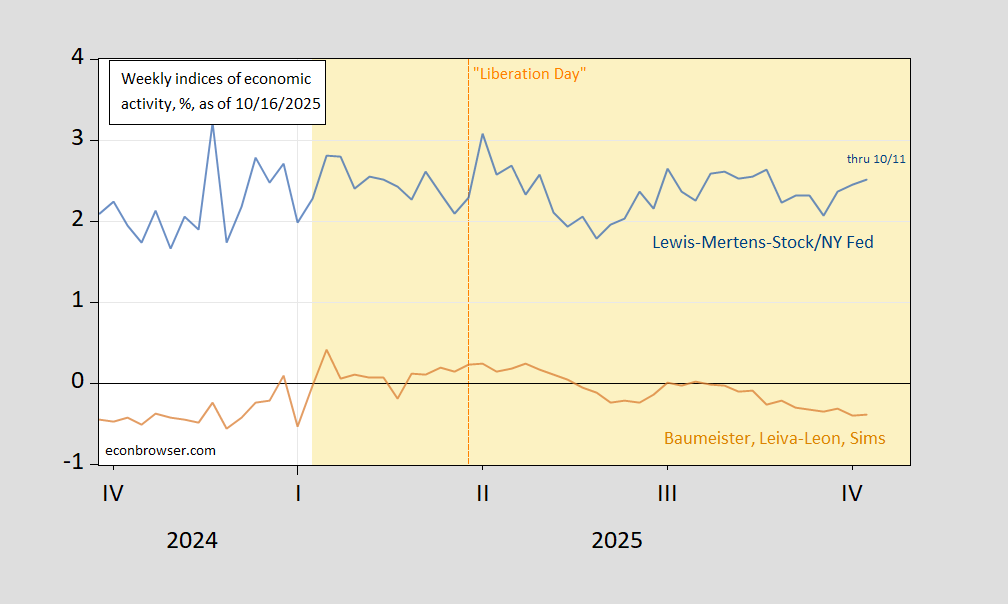
Figure 1: Lewis-Mertens-Stock Weekly Economic Index (blue), and Baumeister-Leiva-Leon-Sims Weekly Economic Conditions Index for US, deviation from trend growth(tan), all y/y growth rate in %. Source: FRED, WECI, accessed 10/16.
Note that WECI is for a deviation from trend growth rate, while WEI is the growth rate. In both cases, growth has decelerated since “Liberation Day” by 0.6 ppts.
(Click on image to enlarge)
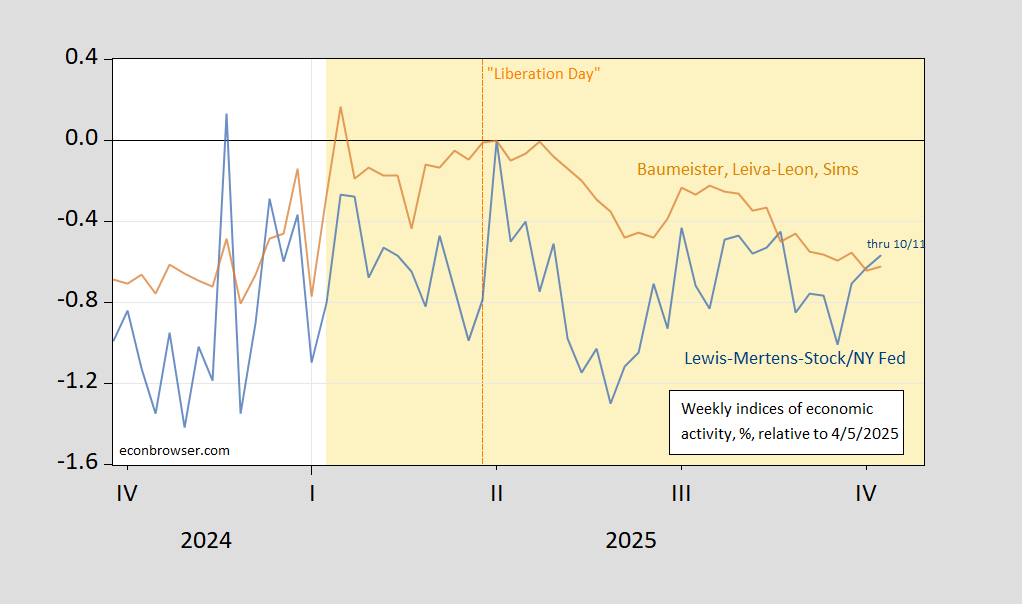
Figure 2: Lewis-Mertens-Stock Weekly Economic Index (blue), and Baumeister-Leiva-Leon-Sims Weekly Economic Conditions Index for US (tan), all y/y growth rate in %, relative to 4/5/2025. Source: FRED, WECI, accessed 10/16, and author’s calculations.
More By This Author:
Some Business Cycle ObservablesPolicy Uncertainty During The Shutdown: Elevated
FX And Gold Reserves In Q2


Comments
Log in or sign up to join the conversation.