
Photo by Dmitry Demidko on Unsplash
COFER data is out for Q2. With estimated gold held by the central banks, we have this picture of reserve composition.
(Click on image to enlarge)
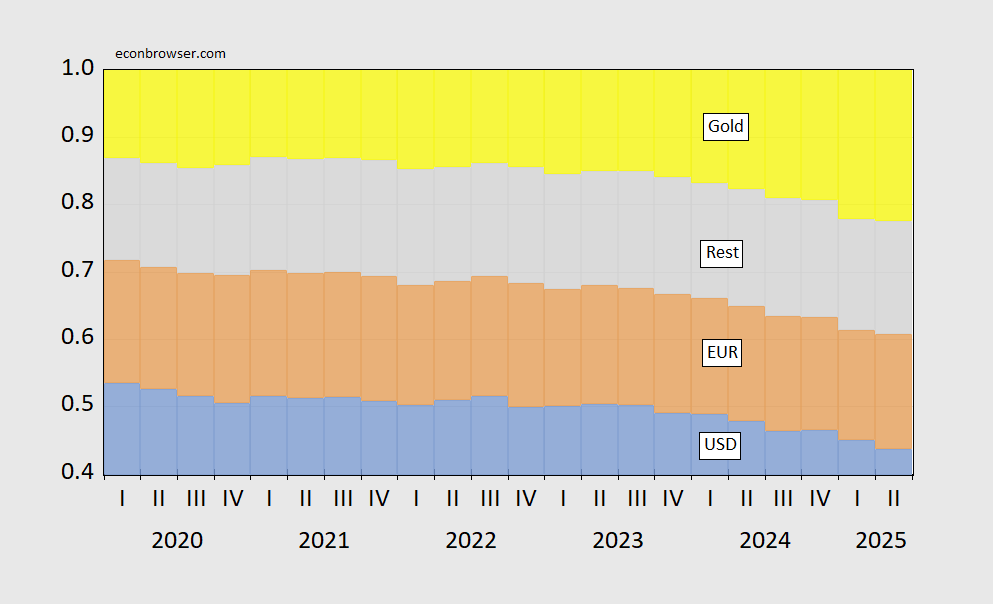
Figure 1: USD shares of fx(blue bars), EUR (tan), all other (gray). USD(EUR) share assumes 60%(35%) of unallocated reserves are in USD(EUR). Source: IMF COFER, and author’s calculations.
Note that the increase in gold holding shares of value is driven primarily by the increase in gold prices, rather than amount of gold. This is shown in Figure 2, where the change in the value of gold reserves relative to 2023Q1 is decomposed into price and quantity components, along with the price of gold index (right side).
(Click on image to enlarge)
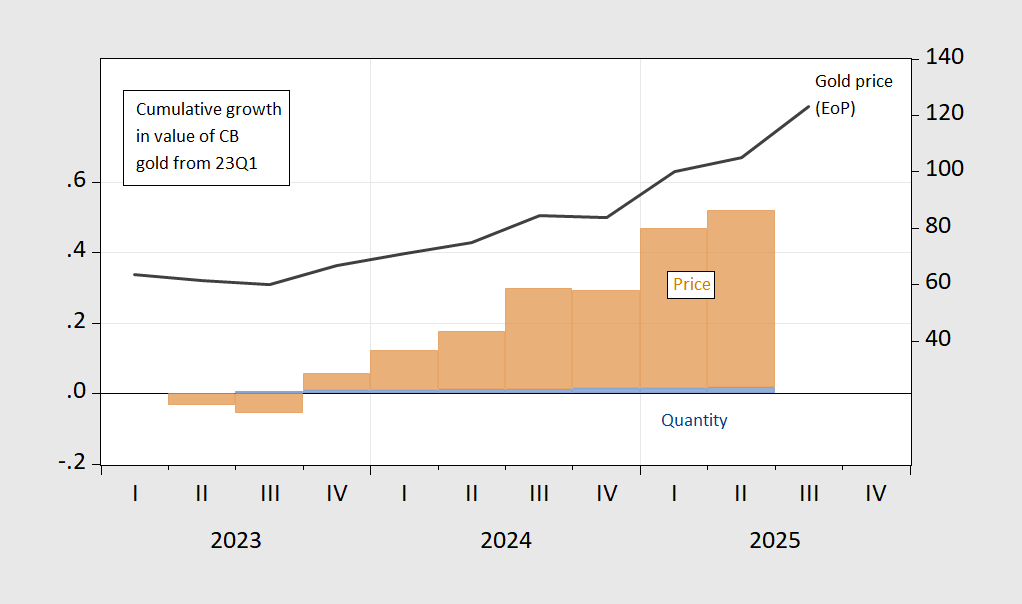
Figure 2: Cumulative growth in price of gold held by central banks (brown bar), and in quantity of gold (blue bar), relative to 2023Q1. 2025Q2 gold is reported acquisitions added to 2025Q1 quantities, multiplied by implied gold price index. Source: COFER, Gold Council to 2025Q1, 2025Q2-Q3 calculations by author based on Gold Council data.
The rise in gold holding shares is primarily due to valuation changes rather than quantity changes. With a Q3 increase in gold prices of 17% (not annualized), this distinction is particularly important.
For an analysis of individual central bank behavior with respect to gold (up to 2022), see Chinn, Frankel and Ito (2025).
More By This Author:
Why A Missed Release Is Sometimes Problematic
On Immigration Policies And The Ag Sector
Why I Think The Administration Would Be Happy To Let The October Employment Release Slip


Comments
Log in or sign up to join the conversation.