

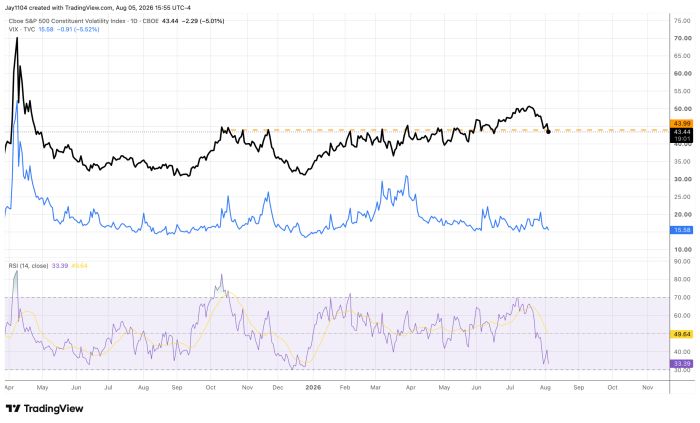
The rally stalled today, which isn’t surprising and probably adds credibility to the view that the recent advance was largely gamma-driven. More importantly, single-stock implied volatility fell sharply as the post-earnings volatility unwind continued. As companies report earnings, the uncertainty surrounding those events is removed, causing implied volatility to decline. I don’t know how much further single-stock volatility will fall, but I would expect the gap between single-stock implied volatility and the VIX to continue narrowing.
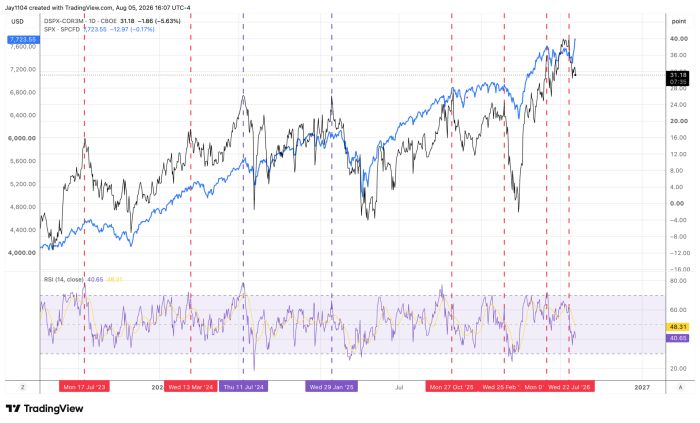
The key here is that this unwind in implied volatility should lead to lower implied dispersion and higher implied correlations. As the spread between dispersion and correlation narrows, it has generally coincided with a more risk-off environment. While the relationship is not perfect, it has been reliable enough over time to make it an indicator worth monitoring.
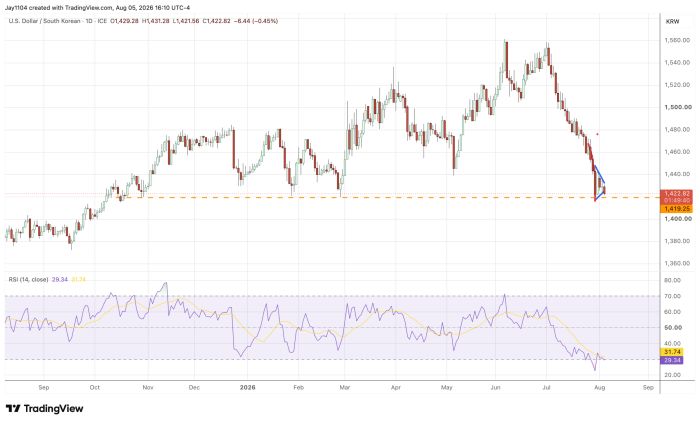
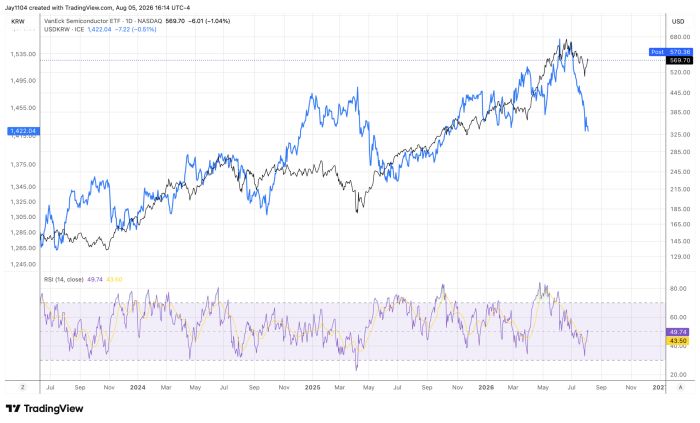
The Korean won strengthened by about 50 basis points today, and technically it appears poised to strengthen further. The USD/KRW exchange rate is currently testing support around 1,420, and a decisive break below that level could open the door to a move toward 1,380.
What another leg of won strength would mean for the semiconductor sector is a good question, and one I’m looking forward to finding the answer to. The theory I’ve been working with is that a stronger won is generally a headwind for the sector, and that relationship has held up reasonably well, aside from the past couple of trading sessions. There is a strong fundamental case to support that view.
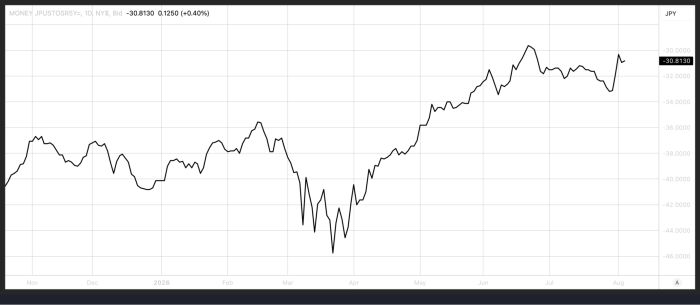
Sticking with FX, despite the latest round of intervention in the USD/JPY, the five-year USD/JPY cross-currency basis swap has remained remarkably stable. If the market were expecting a sustained appreciation of the yen against the dollar, I would expect the basis to become more negative. Instead, it has remained largely unchanged, suggesting the market is not yet pricing in a significant move higher in the yen.


Comments
Log in or sign up to join the conversation.