


The coming week won’t be nearly as busy as the last and should provide a nice period of calm before earnings season begins and the CPI report arrives the following week.
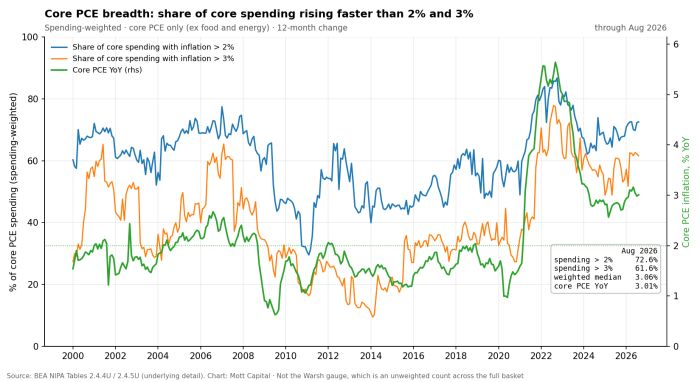
This past week’s data revealed a few interesting facts, and since the new Fed chair likes to look at PCE breadth, I had Claude keep working on my core PCE breadth model weighted by spending. It shows that nearly 62% of the weighted core PCE components are rising by more than 3%, while nearly 73% are rising faster than 2%.
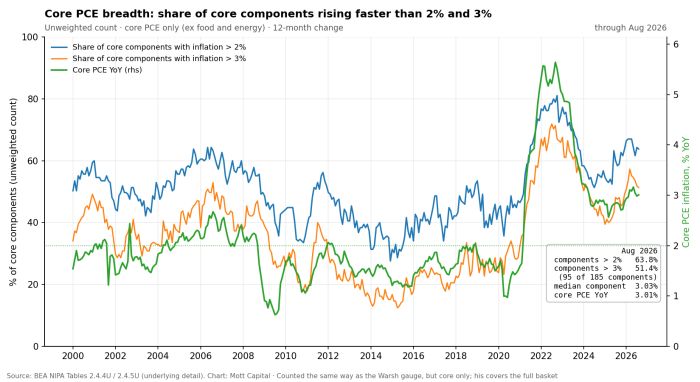
Even on an unweighted basis, where every core PCE component is counted equally regardless of how much consumers spend on it, inflation remains broad. More than 51% of core PCE components are rising faster than 3%, while nearly 64% are rising faster than 2%.
The spending-weighted measure makes the picture even more striking. So if it feels like the things we actually spend our money on are getting more expensive, and the inflation data seems too low, there is probably a reason: the categories that make up the largest share of consumer spending are experiencing even broader inflation than headline and core PCE readings report.
Couple this with the jobs report, which showed that household-survey employment increased by more than 1 million over August and September combined, and you can understand why rates reversed so sharply higher on Friday and why they could rise even further.
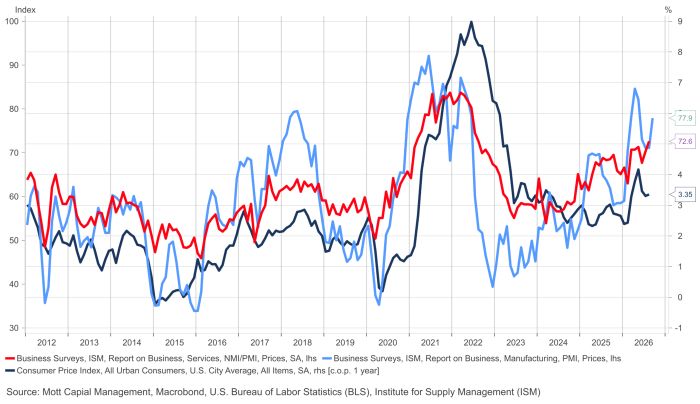
Let’s not forget that we also saw a very hot ISM Manufacturing Prices Paid Index, which surged to 77.9. Now, on Monday, we get the ISM Services Prices Paid Index, which in August reached its highest level since 2022.
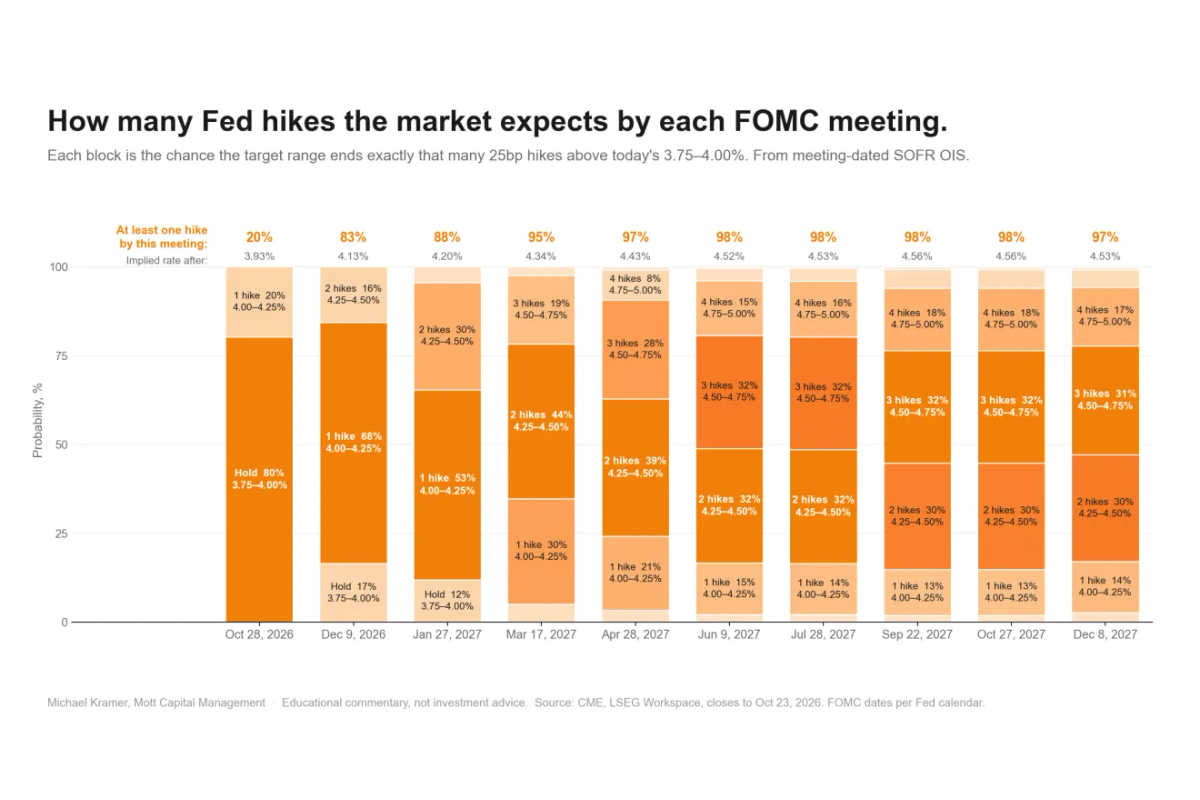
Put it all together—inflation that remains broad, strong household-survey employment growth, and rising prices paid—and it seems pretty clear why rates are rising and why they may be heading even higher.
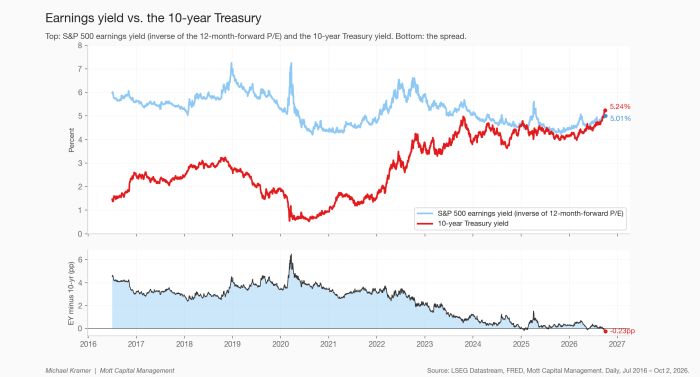
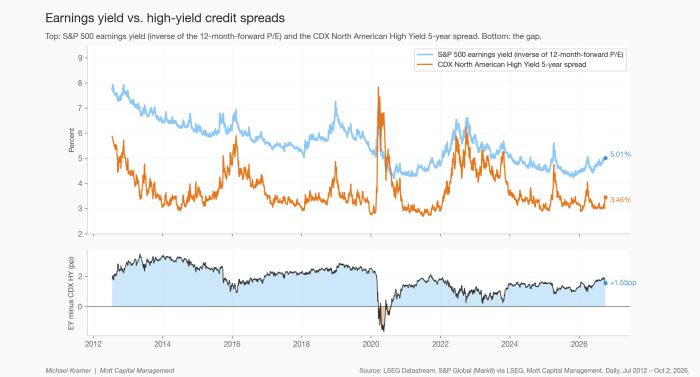
The S&P 500 does care about higher rates. It cares a great deal. You can see that clearly in the index’s earnings yield, which has been steadily climbing along with the 10-year Treasury yield. But the earnings yield hasn’t risen as quickly as the 10-year yield. As a result, the spread has continued to narrow, and the S&P 500’s forward 12-month earnings yield is now below the 10-year Treasury yield.
That means investors can currently earn a higher yield from the 10-year Treasury than the S&P 500’s earnings yield. If the S&P 500 didn’t care about higher rates, its earnings yield wouldn’t be rising alongside Treasury yields. The index hasn’t fallen more because forward earnings estimates have continued to rise, helping push the earnings yield higher without requiring the full adjustment to come through lower stock prices.
But with the 10-year yield now above the S&P 500’s earnings yield, that cushion is getting thinner. If Treasury yields continue to rise, either earnings estimates will need to rise fast enough to keep pace or stock prices will need to adjust lower to push the earnings yield higher.
Another reason stocks haven’t appeared to “care” about rising rates is that credit spreads remain very tight. The CDX High Yield Index is still below 400, and unless credit spreads widen more meaningfully, the S&P 500’s earnings yield is likely to move only gradually higher.
The key is understanding how this transmission works. If financial conditions tighten more meaningfully, the CDX High Yield Index should move higher as credit spreads widen. That, in turn, should put additional upward pressure on the S&P 500’s earnings yield, forcing the P/E multiple to contract further.
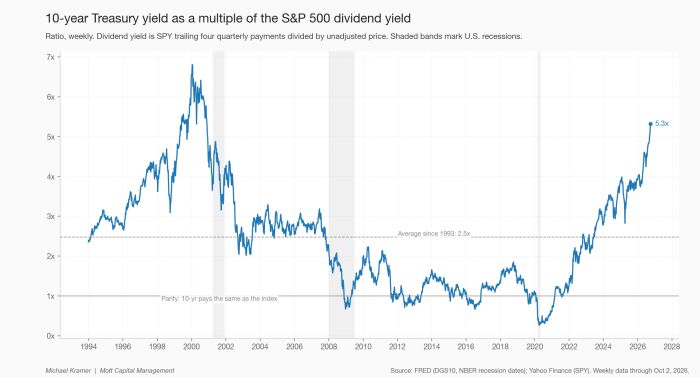
Another way to look at the pressure from higher rates is to compare the 10-year Treasury yield with the S&P 500’s dividend yield. That ratio currently stands at about 5.3x, its highest reading since the late 1990s. In other words, the 10-year Treasury now offers a yield roughly 5.3 times greater than the dividend yield on the S&P 500.
As Treasury yields climb higher, this relationship should put more pressure on equities. At some point, the yield available on the 10-year Treasury becomes too attractive for investors to ignore. For the S&P 500 to compete, its dividend yield would need to rise, which, all else being equal, means stock prices would need to fall.
Of course, if rates were to stop rising and reverse because the market finds a new angle to play, that would probably lead to the P/E multiple expanding again. So, at this point, if you think rates are due to fall, you would probably also think stocks are cheap relative to where they have traded over the past few years and could see a sharp rebound on any meaningful reversal in rates.
But for now, the economic data still suggests that a sustained reversal in rates is probably a little further off.


Comments
Log in or sign up to join the conversation.