

Strange day. For some reason, I lost track of the market during the afternoon because I had a few other projects to attend to.
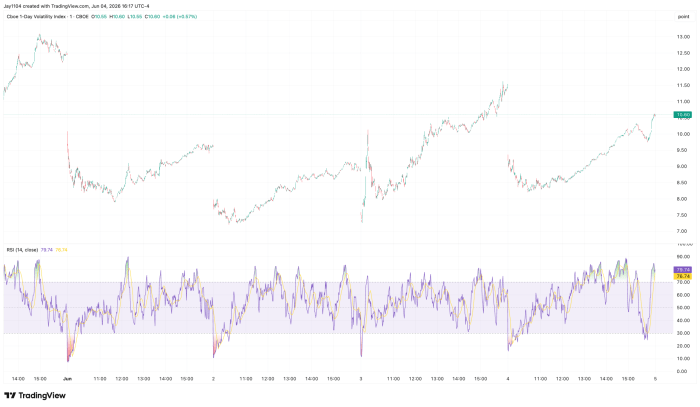
The market clearly is not concerned one bit about tomorrow’s May jobs report, with the VIX1D finishing lower and below 11. At that level, there should be the potential for a volatility crush rally, unless futures decline dramatically overnight.
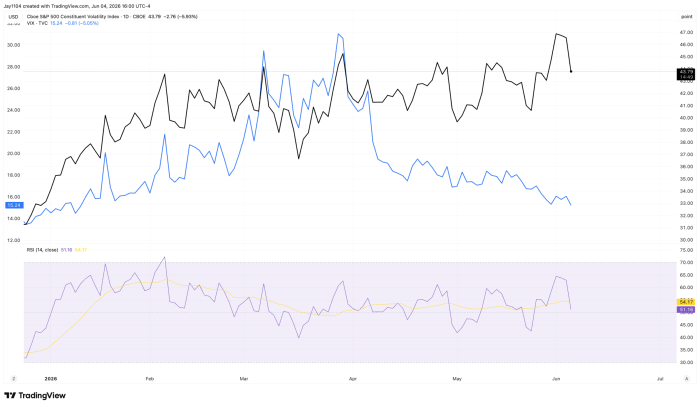
The VIX was also crushed on the day, falling below 16. If volatility is going to decline throughout the session, then you would typically expect stocks to move higher, as volatility is crushed.
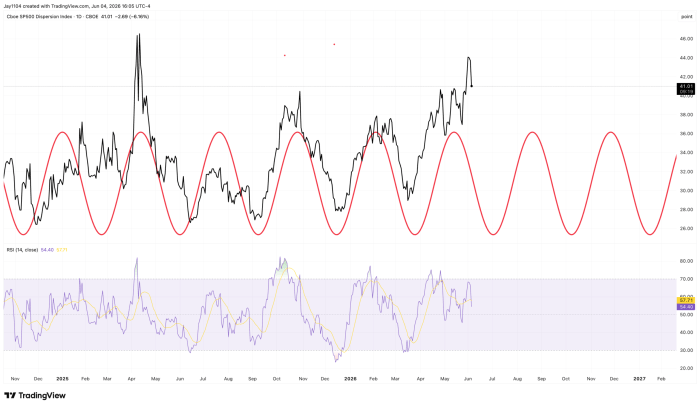
Dispersion fell sharply today as single-stock volatility was crushed, with Broadcom’s (AVGO) implied volatility declining considerably following its earnings report.
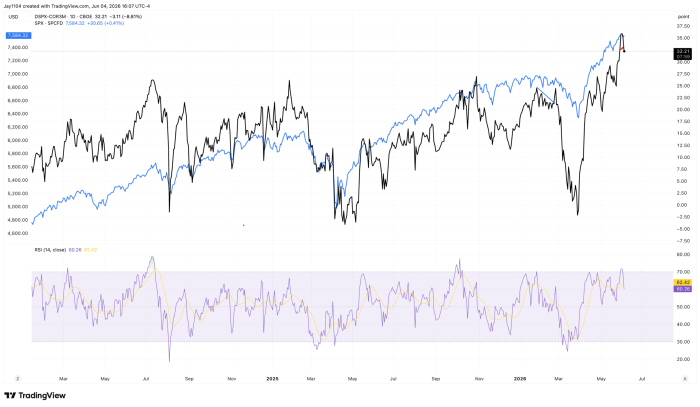
The Dispersion Index has been due for a peak, and perhaps now that Broadcom earnings are out of the way, that can finally happen. Unfortunately, we will not know until it does. Broadcom carries a weighting nearly as large as Amazon’s (AMZN) and larger than Meta’s (META) in the S&P 500, so it is entirely possible that one reason dispersion has continued to work is because of Broadcom. However, I have no proof of that; it is just a theory.
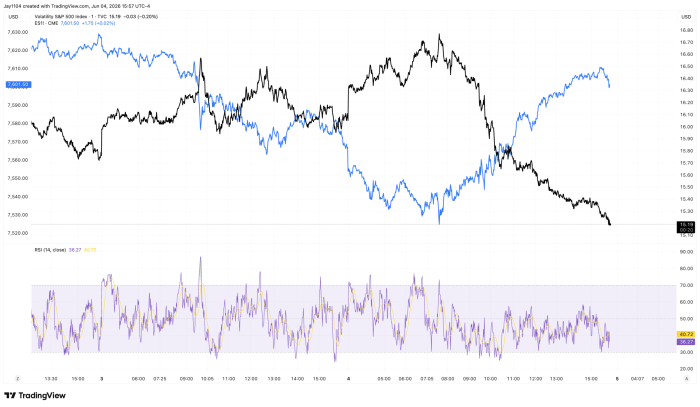
Three-month implied correlations rose today, narrowing the spread with dispersion. Historically, when this spread begins to turn, the S&P 500 tends to follow, and that relationship tends to work in both directions.
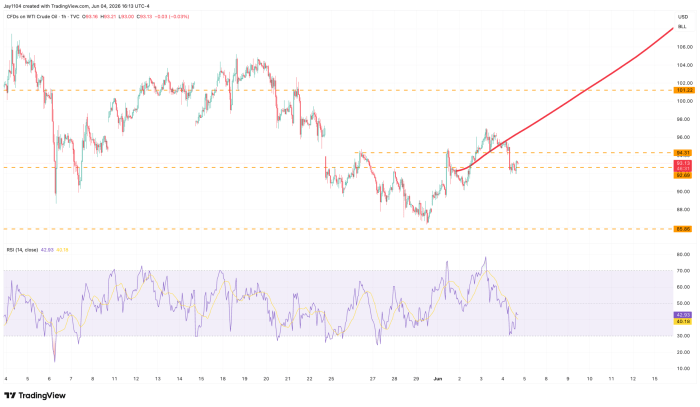
Oil’s 3% decline also helped reduce equity volatility. I am not entirely sure why oil was down so sharply today, but at this point, the news flow changes so rapidly that I have largely stopped trying to keep up with every headline.
The inverse head-and-shoulders pattern that appeared to be forming yesterday is now at risk of breaking down. For now, as long as oil remains above $90.50, I think the pattern can still work. However, if support breaks, the pattern is likely invalid, and my interpretation is wrong.
That’s all for today


Comments
Log in or sign up to join the conversation.