


This week’s economic data probably takes on added importance given the recent surge in interest rates. The ISM Manufacturing report is due on Monday, followed by JOLTS on Tuesday, ADP employment and the ISM Services report on Wednesday, productivity and unit labor costs on Thursday, and, of course, the jobs report on Friday.
As if that weren’t enough, the Quarterly Refunding Announcement also comes on Monday. It will tell us about the government’s borrowing needs for the rest of the year and, perhaps more importantly, the composition of how it plans to finance them. Given the surge in long-end rates, it seems unlikely to me that the Treasury will suddenly shift from heavy bill issuance to greater coupon issuance. I would expect bill issuance to remain the primary source of funding.
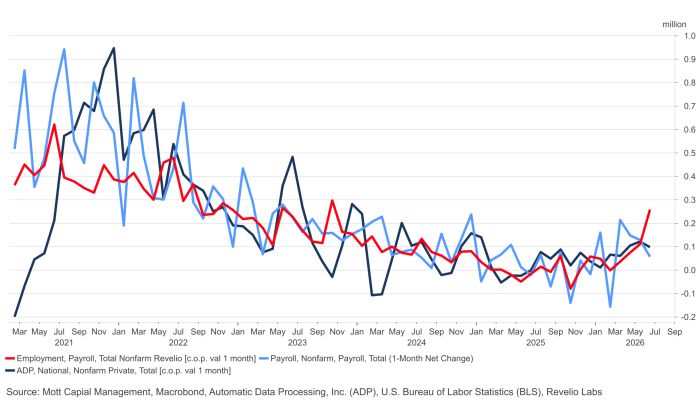
The jobs report is expected to show that 83,000 jobs were created in July, up from 57,000 in June. One thing worth pointing out is that the Revelio Labs job data is released the day before. That data has shown a solid improvement in U.S. hiring trends over the past couple of months and appears to lead both the BLS and ADP data by a few months. So it’s worth keeping an eye on that release on Thursday.
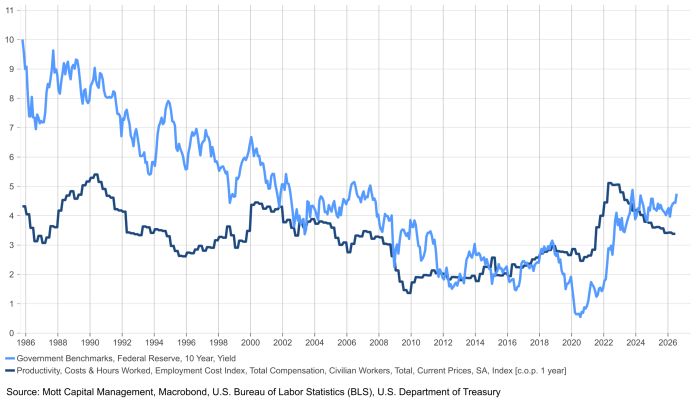
The Employment Cost Index rose more than expected for the second quarter when it was reported on Friday, increasing 0.9% versus expectations of 0.8%. Historically, there has been a relationship between the Employment Cost Index and the 10-year Treasury yield, so it may have partially contributed to the move higher in rates on Friday.
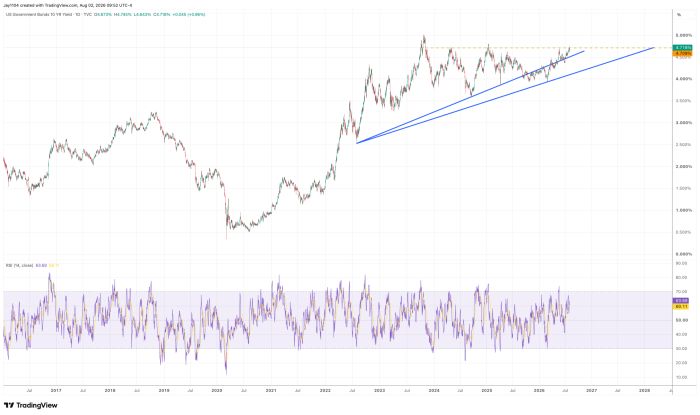
The 10-year Treasury yield finds itself at a very important inflection point as it pushes up against resistance in the 4.7% to 4.8% range. A break above that area would open the door to the October 2023 high near 5%. In that sense, this is shaping up to be a critical week for bonds and interest rates.
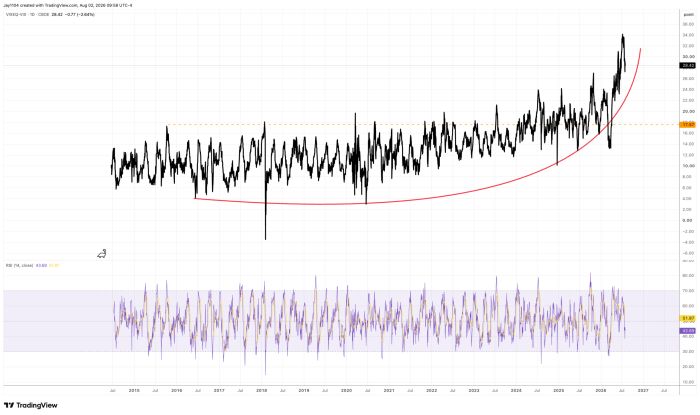
Single-stock volatility fell sharply this week and should continue to decline as earnings season progresses. Implied volatility typically rises ahead of earnings reports and falls afterward, and that should lead to a further decline in the VIXEQ.
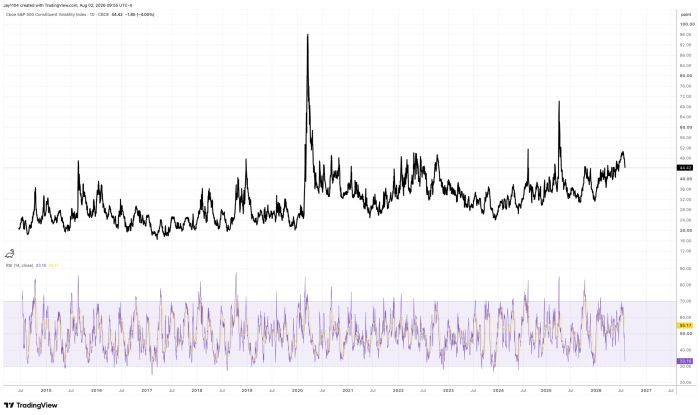
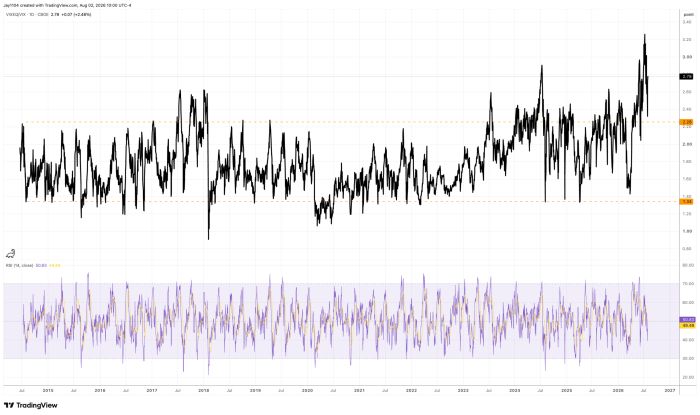
This could also result in the spread between the VIXEQ and the VIX Index narrowing, although it is unclear by how much. There used to be a well-defined range for this spread, but over the years it has widened, and its baseline has gradually moved higher. As a result, the spread may not have as much room to contract as it once did.
When viewed as a ratio, however, the distortion is not nearly as pronounced, suggesting there is still quite a bit of contraction ahead.
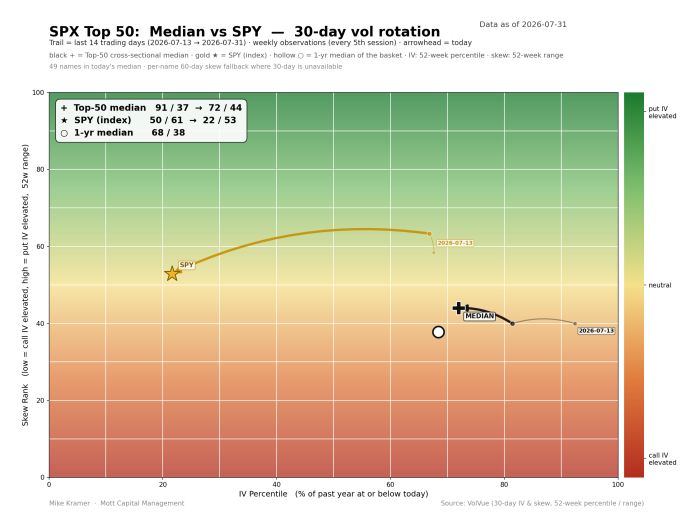
The median implied volatility and skewness for the top 50 stocks in the S&P 500 have both declined, but implied volatility for the index has fallen even more. That is likely why implied correlations have not increased.
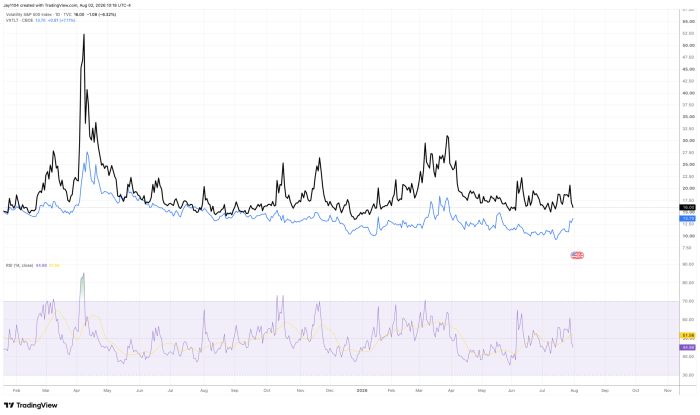
However, index volatility may have a harder time falling further, especially if volatility in the bond market continues to rise, as it has recently. Typically, when implied volatility in the bond market increases, implied volatility in the equity market rises as well.
Additionally, with this week’s calendar packed with major macroeconomic events, the VIX is likely to move higher heading into those releases. As a result, I would expect implied correlations to begin rising this week, which could keep pressure on risk assets.


Comments
Log in or sign up to join the conversation.