


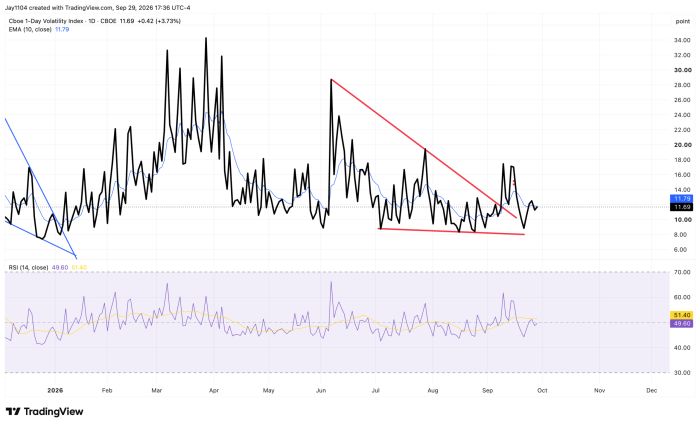
Stocks finished the day mostly lower ahead of tomorrow’s PCE report. PCE tends to be relatively well anticipated because many of the underlying inputs are already known by the time the report is released, so a meaningful deviation from consensus would be somewhat unusual. The 1-day VIX closed below 12, suggesting the options market is not pricing in much event risk around the report.
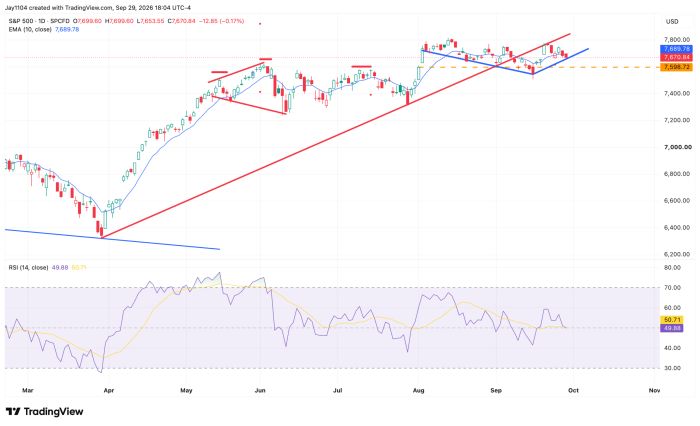
Technically, the S&P 500 has broken below the uptrend that formed following the March 2026 low. The index has since rallied back to retest that broken uptrend and, for now, we are waiting to see what happens next.
If the break represents a reversal of the uptrend, then there is an opportunity for the move lower to begin picking up steam. If it does not, then we should see the index recover and make new highs over the next couple of days. Technically, though, a failure at the broken uptrend would not be a bullish indication.
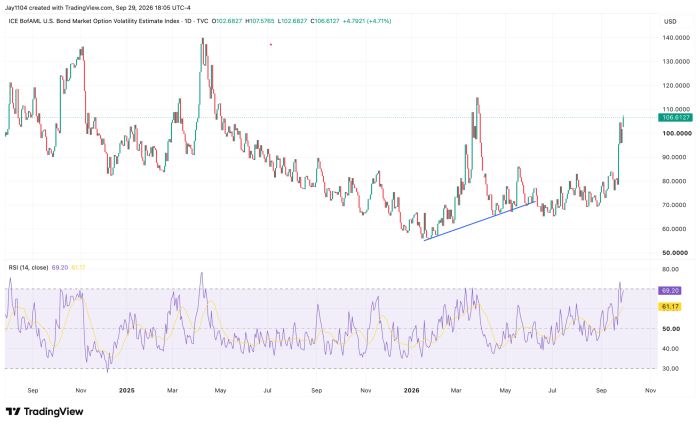
The MOVE Index rose today ahead of the PCE report, which is to be expected. Assuming there are no meaningful surprises in the PCE data, bond market volatility should ease tomorrow following the report before potentially rising again on Thursday ahead of Friday’s jobs report.
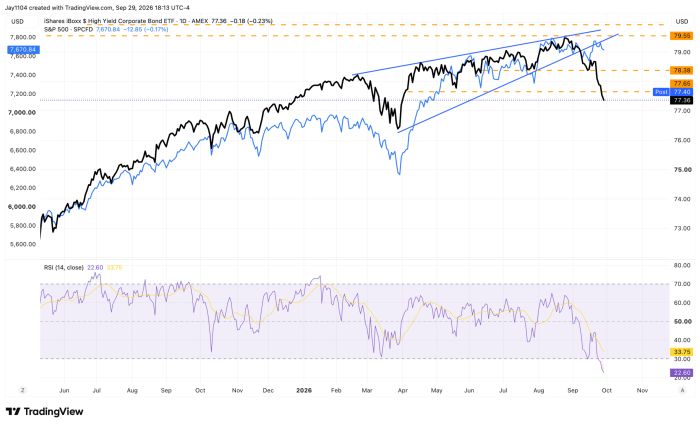
HYG really formed a nearly perfect rising wedge pattern a few weeks ago, and it has since done what you would expect following a breakdown from that pattern. What is surprising is that the S&P 500, which has generally tracked HYG fairly reliably, has not followed it lower. So we are left to wonder whether the S&P 500 will eventually need to catch up—or, for that matter, catch “down”—to the move we have already seen in HYG.
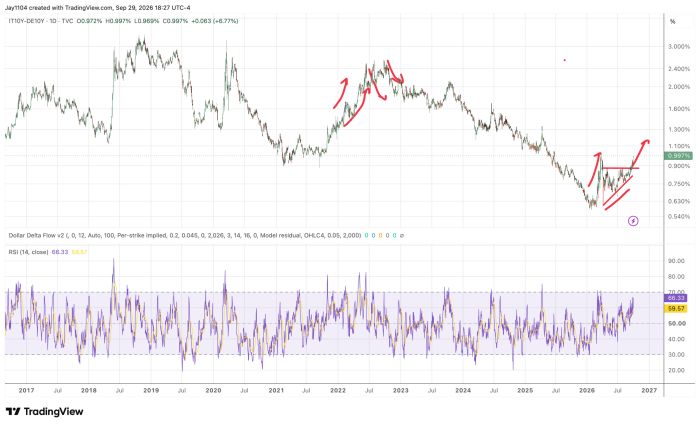
Finally, the Italian 10-year yield rose 6 bps more than the German 10-year yield, with the spread between the two widening to 100 bps. Credit spreads are widening globally, suggesting this is not simply a U.S. phenomenon.
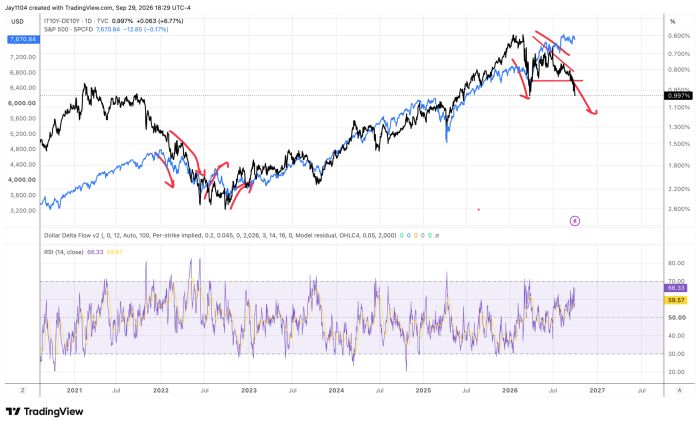
When you invert the spread and overlay it with the S&P 500, the divergence becomes clear; equities are not reflecting the deterioration taking place in the bond market.



Comments
Log in or sign up to join the conversation.