


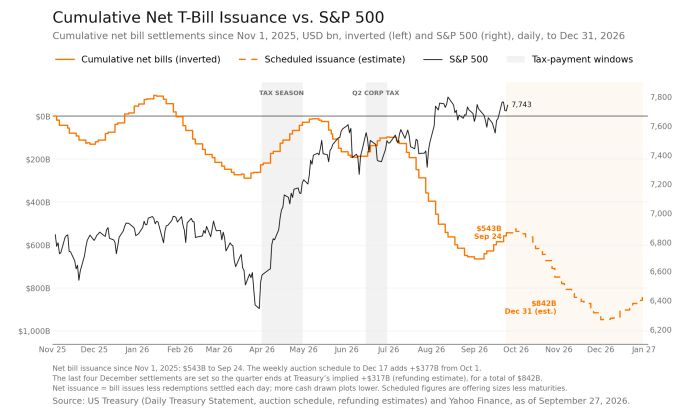
The coming week will be an important one for markets, with economic data likely to shape the next Fed move. A major change is also likely to go unnoticed: the liquidity shift about to take place. This week, Treasury bill issuance shifts from paydowns to net issuance, with Tuesday, September 29, as the last day of paydowns and Thursday, October 1, as the first day of net issuance. The pace builds from mid-October, when weekly net issuance runs at $50 billion to $75 billion.
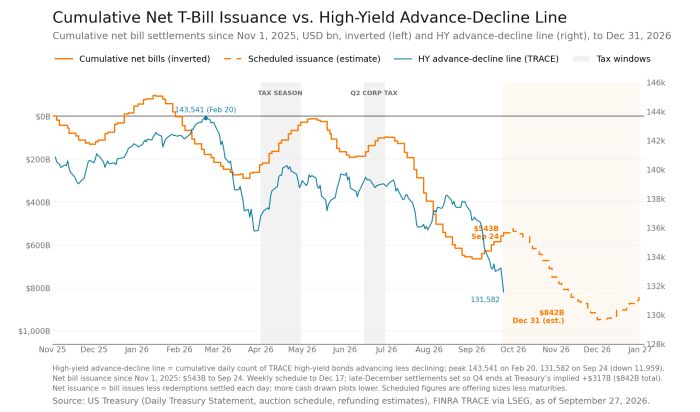
The liquidity flows that supported the market in September will reverse and become a headwind through the beginning of December. We already know how poor liquidity conditions have been from market breadth and the high-yield advance-decline line, and those may still get worse.
While the S&P 500 didn’t suffer a big decline during the last issuance phase in July and early August, it didn’t do much either. Its performance was defined by a short-term pop around mega-cap earnings at the end of July and the first few days of August.
The same can’t be said of the high-yield advance-decline line, which has shown significant deterioration that continued right through this past week.
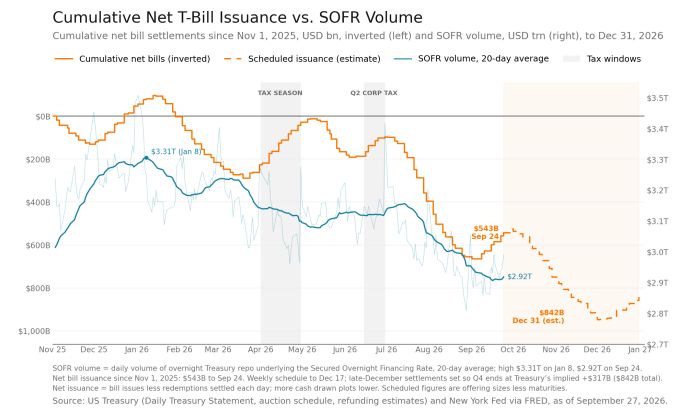
SOFR volumes have also fallen steadily over the past year, and the trend in net issuance could well be playing a role in that.
So the bottom line is that issuance may not directly mean stocks fall; it may just mean they don’t perform as well as most expect, and I think it’s worth monitoring.



Comments
Log in or sign up to join the conversation.