


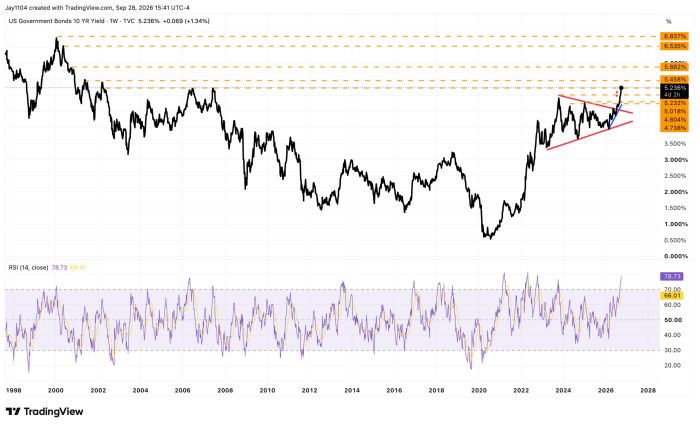
Rates continued to move higher, with the 10-year pushing up to resistance at 5.25%. Bond volatility, as measured by the VXTLT, also rose on the day. With the PCE report on Wednesday and the jobs report on Friday, it is a pretty big week for markets.
Clearly, numbers that come in higher than expected in either report could be enough to send yields even higher. The trouble is that above 5.25%, a move to 5.5% becomes a fairly easy path, with little resistance in the way.
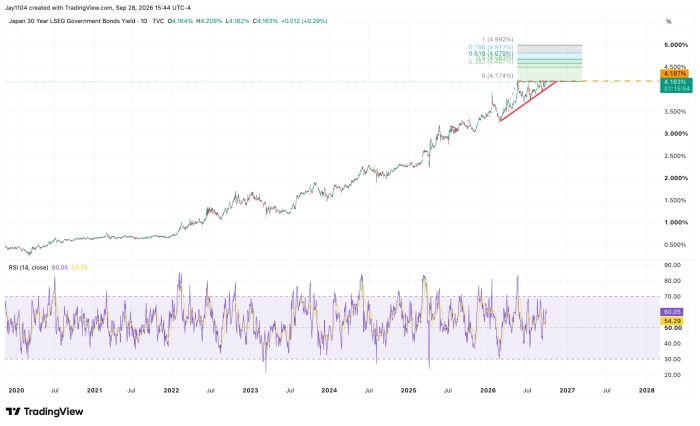
The thing that stands out, or perhaps doesn’t stand out enough, is how much of what is happening with rates is not just a U.S. phenomenon. It is a global one. Japan’s 30-year JGB finds itself in a really uncomfortable spot, with a large ascending triangle pattern that has formed in recent weeks and resistance at 4.17%. Imagine where the 30-year JGB could go should it clear resistance at 4.17%. I’m guessing 5% isn’t all that unreasonable.
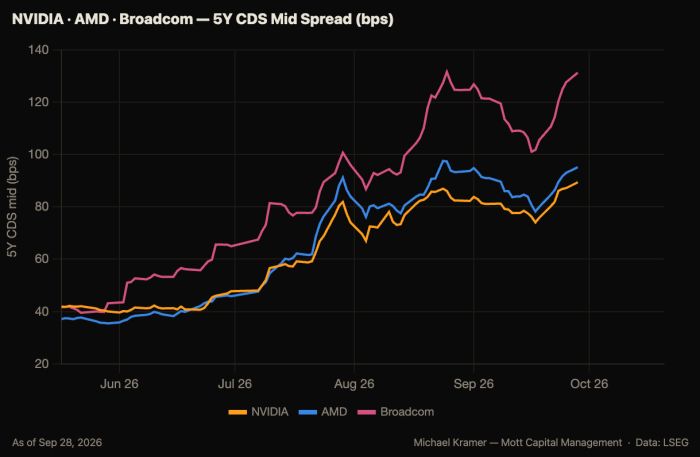
Thank goodness Nvidia (NVDA) did that $150 billion deal, or else the S&P 500 could have been down even more than it was. But hey, the credit market has a different opinion on Nvidia, with its CDS widening even further today to 89 bps. Broadcom (AVGO) and AMD saw their CDS widen as well.
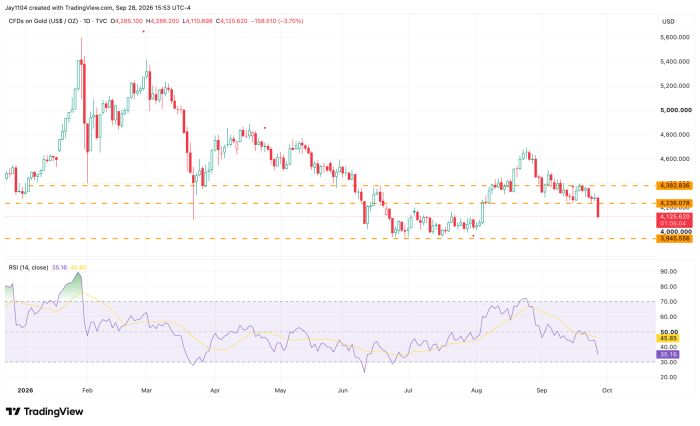
Gold definitely does not like those rising real yields. The metal fell nearly 4% today and is back below $4,200. It makes a move back to $4,000 look increasingly possible.
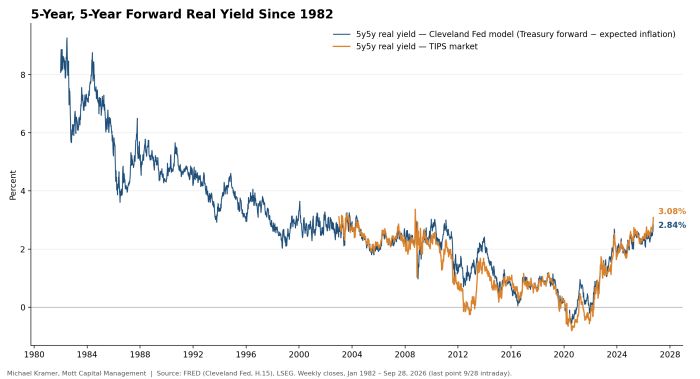
I put together this chart for my paying members area today, showing the 5Y5Y forward real yield versus a derived model using existing Cleveland Fed data that goes back further than the market-based data. In essence, real yields are pricing in a 5-year real yield of around 3.08% five years from now.
Assuming the 5Y5Y forward inflation expectation runs at around 2.3%, that implies a nominal 5-year rate five years from now of roughly 5.3%, perhaps 5.4%.
We have returned to pre-QE rates. The days of easy monetary policy are over, at least based on current market expectations.
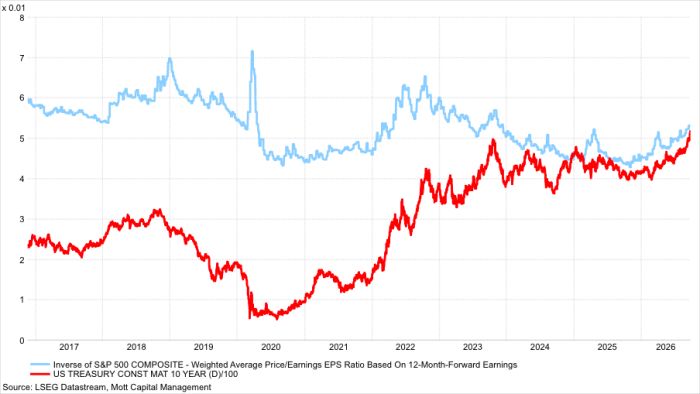
Whether stocks care or not, I would argue that they do care about rising rates. You can see it directly in the S&P 500 earnings yield, which has been rising right along with the 10-year nominal yield. The only thing keeping the index up is that the “E” has seen several upward revisions.
However, as the earnings yield risks falling below the 10-year yield, the S&P 500’s ability to hold up may be nearing the end of the road, especially if credit spreads really start to widen.



Comments
Log in or sign up to join the conversation.