


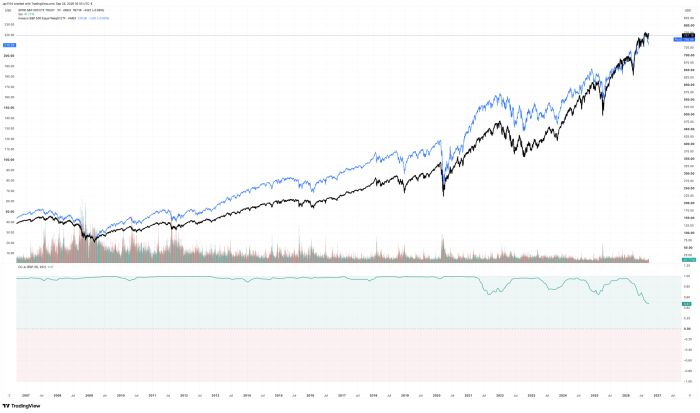
The S&P 500 and the equal-weight ETF have diverged significantly. Over the past year, the two-month moves in SPY and RSP have lined up less and less, and the correlation between them has dropped to about 0.47, the lowest reading in nearly two decades. A reading this low suggests the divergence has been building for a long time and is getting extreme.
From 2007 through 2020, the two indexes moved together almost perfectly, through the financial crisis and the COVID crash, and only since 2021 have they started to part ways. The dips in mid-2021, early 2023, and early 2025 never fell much past 0.6, and none of them was resolved by the equal-weight index catching up. Each time the gap closed because the cap-weighted index came back down to meet it.
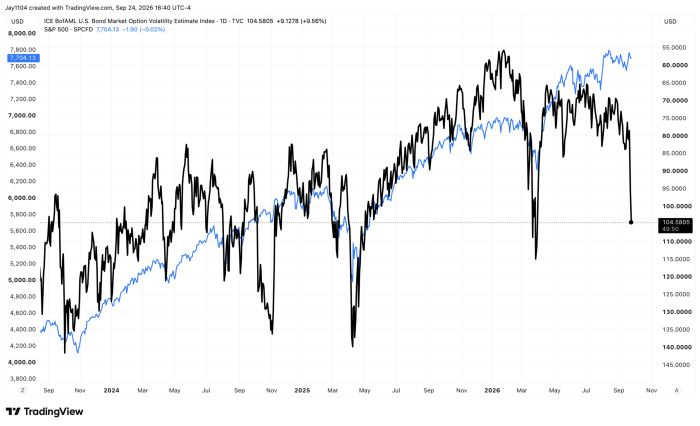
Meanwhile, the MOVE Index, a measure of bond market volatility, has surged to 104 from 78.5 on Tuesday. Someone forgot to tell the S&P 500 that it is supposed to decline when bond market implied volatility rises, especially with a move of this size.
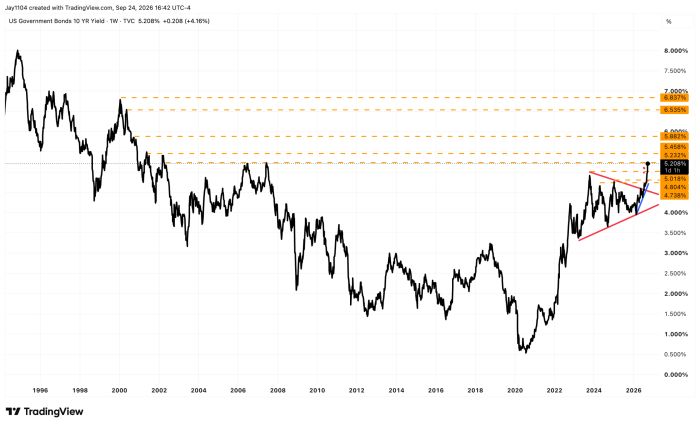
The 10-year closed today at 5.21%, right at resistance. A break here sends the 10-year to 5.45%, and then perhaps 5.9% or even 6.5%.
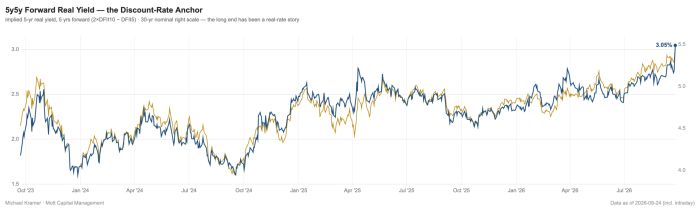
The 30-year has moved to 5.5%, while the 5Y5Y forward real yield rose to about 3%. Real rates continue to push higher because the market wants more yield, and we are living in a world that is more supportive of higher rates, as the last few years have taught us.
The HYG ETF fell again, and its gap with the SPY is widening. It is not just RSP that is doing this.
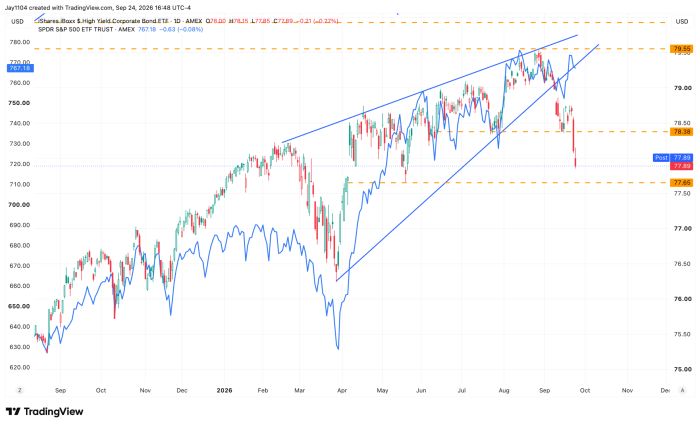
Unfortunately, when the S&P 500 finally does give way, it is unlikely to be a pleasant time.



Comments
Log in or sign up to join the conversation.