


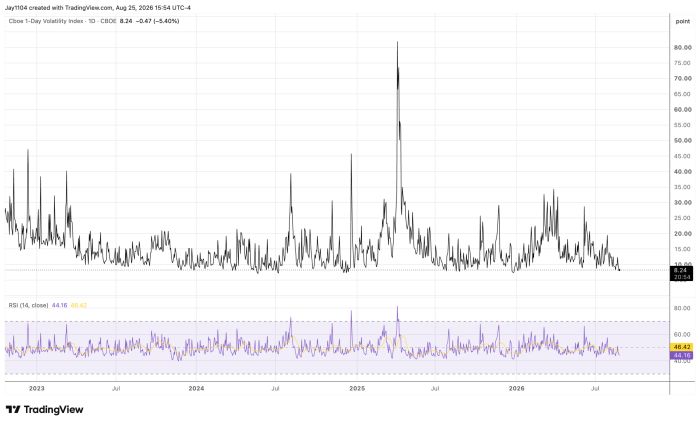
Stocks finished higher but not by much. The trading range was tight, with the 1-day VIX finishing below 9. That probably won’t stay that way for long — with Nvidia (NVDA)’s results tomorrow night, the VIX 1-day is likely to be much higher by Wednesday’s close. Since 2022, it has not often been the case that the VIX 1-day has closed at such low levels, so the range of implied volatility is likely to expand from here.
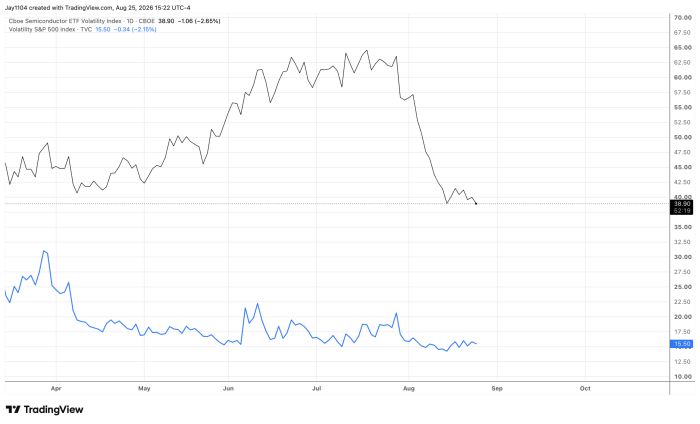
Implied volatility for the semiconductor sector continues to decline, with the VXSMH dropping to 38.9, its lowest level since August 14 and, before that, January. The thing is, semiconductor implied volatility is falling faster than S&P 500 implied volatility, which is somewhat surprising, given that Nvidia reports tomorrow night. In fact, the VXSMH was in the mid-60s at the start of July, so it has nearly been cut in half in six weeks, while the VIX has only dropped a few points.
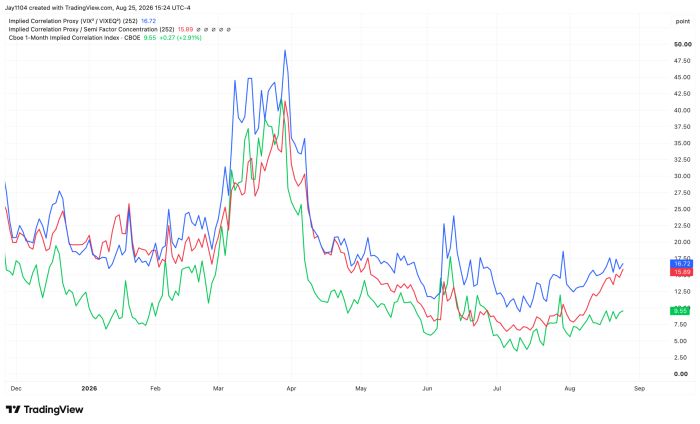
That is leading my proxy for semiconductor-sector implied correlations to rise faster than index-level implied correlations. It means that semi options are becoming less expensive relative to index options, and that the market is starting to price the semiconductor sector more in line with the S&P 500, rather than on its own story.
The problem is that, with semis and the index starting to be priced to move together, there is less cushion from the rest of the market. So if semis drop after Nvidia reports, they are more likely to take the S&P 500 down with them.
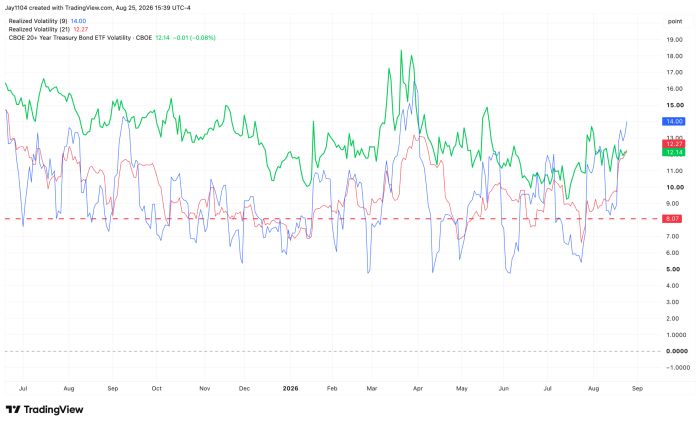
Another oddity heading into Jackson Hole, amid worries over the long end of the curve, is that VXTLT now trades just below 21-day realized volatility in TLT, and well below 9-day realized volatility. To me, that seems odd, given the event risk that Friday brings for the bond market and the risk of yields moving higher. It is as if the options market doesn’t believe volatility in the long end of the curve will persist.

Comments
Log in or sign up to join the conversation.