

Inflection Point In Long-Term Trend For Energy Prices?
The most impressive performance today was delivered by WTI Crude Oil. The Saudis are expressing a willingness to cooperate with other OPEC members and non-member energy producers in order to stabilize future global energy prices. The “oil market-share war” has taken out some of North America’s shale producers, but MENA (Middle East North Africa) is suffering collateral damage as well. At next week’s OPEC meeting, they have plenty of motivation to reconsider realigning their strategic production ceiling which is currently @ 30 million barrels per day:
- A -43% drop in oil prices over the last 52 weeks.
- Majority of OPEC members’ GDP is derived from energy revenues which are used to subsidize spending programs and counter-balance social unrest and geopolitical destabilization.
- Reality of slower global economic growth in Asia and Europe exacerbating the supply-demand imbalance or oil glut.
This is not to suggest a 180-degree trajectory in energy prices anytime soon, but the above does suggest we may be at an inflection point in the long-term trend for energy prices, despite the potential for further short to intermediate bearish price trends.
Meanwhile, the U.S. economy may be decelerating as today’s Manufacturing Index Flash report for November-2015 came in @ 52.6 vs. consensus @ 54.5 and prior month @ 54.0. This news alone was sufficient to release some pressure on bond investors as treasury rates retreated for both the 10-year and30-year government securities.
In Real Estate, U.S. Existing Home Sales in October-2015 declined -3.4% monthly and contracted annually to 3.9% vs. previous readings @ 8.8%. The report, which had actual sales @ 5.36mm vs. prior @ 5.55mm, suggests that real estate may not be as strong a source of economic growth as perceived. However, the data did not have any negative impact on the Dow Jones indexes for Real Estate or Homebuilders in today’s trading.
The U.S. Dollar briefly touched resistance @ 100.00 but, if your eyes blinked, then it would have certainly been missed. Despite the slightly weaker economic data, the dollar still managed to finish in positive territory as it is being buoyed by the high probability of interest rate increases. Conversely,Gold, along with the CRB (Commodities) Index, is falling in price for this very reason.
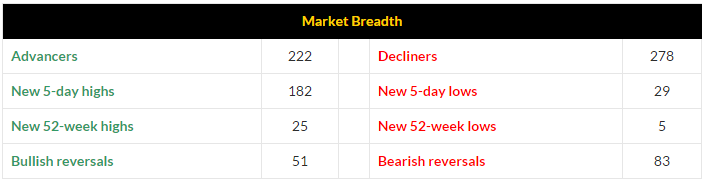
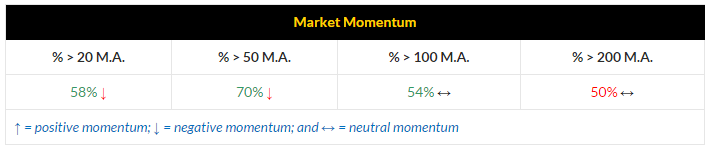
In the Stock Market, performances were mixed as the Russell-2000 outperformed the larger cap SP-500 and Nasdaq-100 indexes. Volatility advanced almost 1%. However, when it comes to risk, momentum in both, i.e. equities and the VIX, has been decelerating and thus further underscoring the uncertainty still extant among investors.
Performance Summary
- Trends: ST = short-term; MT = Intermediate-term; LT = long-term

Market Condition
The SP-500 took a pause for the day, which should come as no surprise given that we are coming into a long holiday weekend. The rally is losing some momentum, but this provides an opportunity for consolidation. A key support level for now is the 200-day moving average or 2065. The 20-day moving average is @ 2080 and a violation of it could initiate a mild correction and testing of the 200-day moving average.
Keeping it short and sweet at Hillbent for the Market Direction…

Volume Radar Alerts
- Vol % = volume percentage greater than average volume
- SIR = short interest ratio or days to cover



Comments
Log in or sign up to join the conversation.