
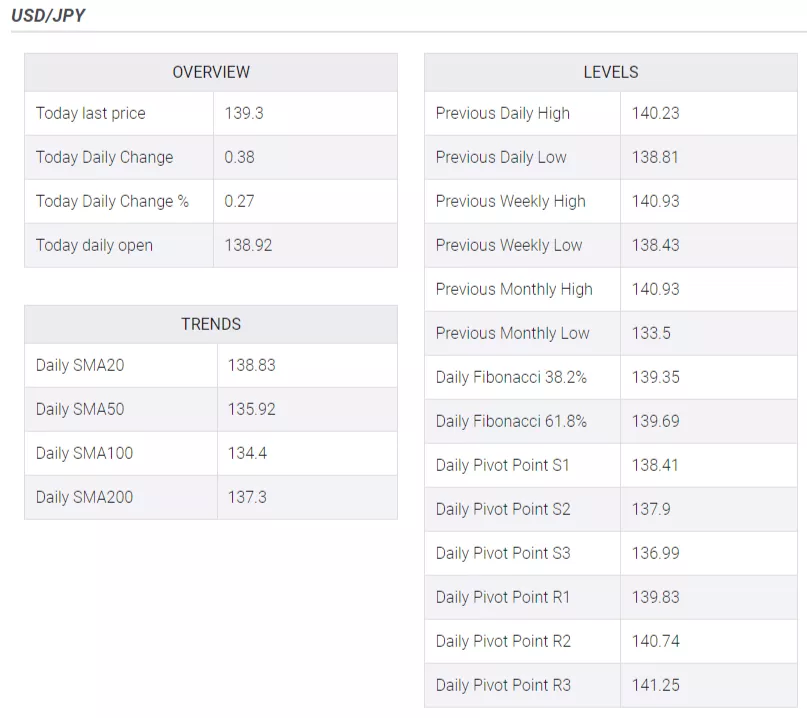
USD/JPY bounced off weekly lows, and the 20-day Exponential Moving Average (EMA) confluence on Friday after soft jobs data from Canada spurred a jump in US Treasury bond yields. The USD/JPY is trading at 139.37, up 0.32%.
USD/JPY Price Analysis: Technical outlook
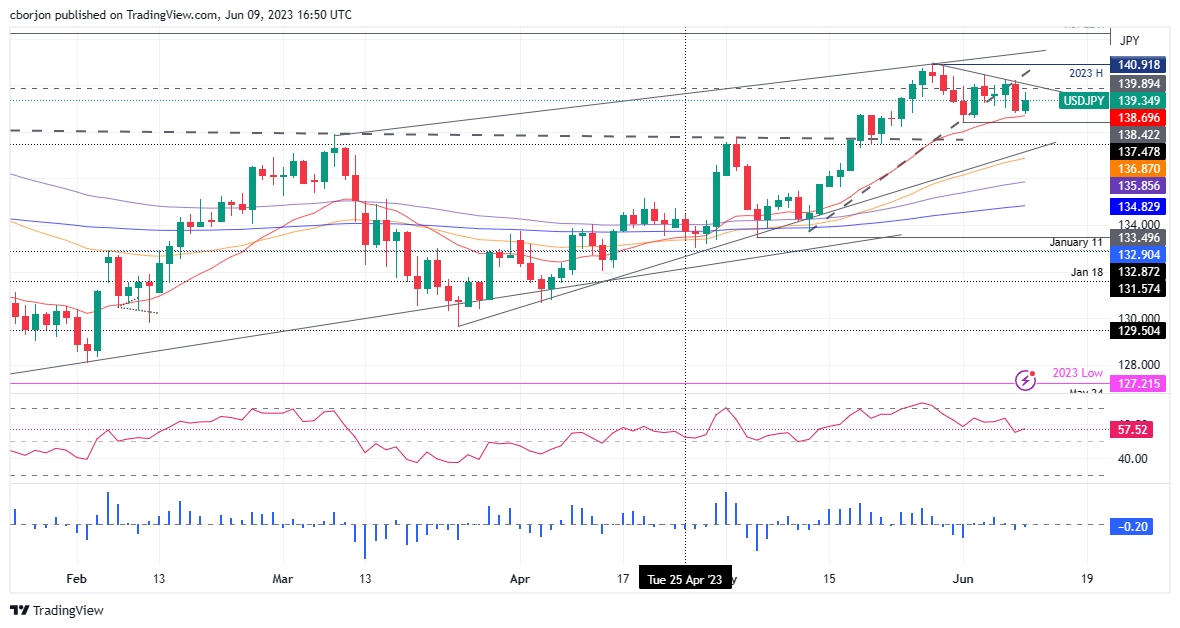
After rallying toward new year-to-date (YTD) highs of 140.91 towards the end of May, the USD/JPY dipped towards 138.40, as threats of a possible intervention by Japanese authorities triggered four consecutive days of losses. Amidst those plays, US Treasury bond yields, edging lower, added another reason to the downturn. Since then, a bullish engulfing candlestick pattern formed, creating a base at around the 138.40s area, which was tested on Thursday, but sellers failing to crack below the 20-day EMA at 138.69, kept support intact, as buyers get ready for an assault toward 140.00.
Another factor that supports the USD/JPY moving upwards is the Relative Strength Index (RSI) indicator, which sits in bullish territory, while the three-day Rate of Change (RoC) suggests buyers gathering momentum as the RoC approaches neutral levels.
Therefore, USD/JPY's first resistance would be 140.00. A breach of the latter will expose the weekly high at 140.45, ahead of challenging the YTD high at 140.91. On the other hand, a dip below 139.00 could open the door to test the bottom of the abovementioned range at around 138.40.
USD/JPY Price Action – Daily chart
(Click on image to enlarge)
More By This Author:
EUR/USD Price Analysis: Faces Barricades Around 1.0780 As USD Index Rebounds
USD/JPY Plunges Amid U.S. Jobless Claims Rising, Japan’s Surprising GDP Surge
AUD/USD Rejected From 200-day SMA As USD Strengthens


Comments
Log in or sign up to join the conversation.