

Image Source: Unsplash
The AUD/USD trades with losses on Wednesday below 0.6650 area after hitting a daily high at 0.6717. A stronger US Dollar during the American session pushed the pair to the dowside. A surprising 25 basis point (bps) hike by the Bank of Canada (BoC) slightly strengthened the case for a hike by the Federal Reserve (Fed) in the upcoming June 13-14 meeting, sending US yields higher, and favoring the US Dollar.
US bond yields rise ahead of Fed decision
The BoC announced on Wednesday a rate hike by 25 bps while markets expected them to maintain them steady at 4.5%. In that sense, adding to the Reserve Bank of Australia’s (RBA) decision on Tuesday, the expectations of a 25 bps hike next Wednesday by the Federal Reserve (Fed) slightly increased. However, the CME FedWatch tool suggests that investors are placing higher probabilities on the Fed refraining from hiking rates and instead, keeping the target rate steady at 5.25% but the odds of a 25 bps hike jumped to 30%.
As a reaction, the US bond yields are seeing gains across the curve. The 10-year bond yield rose to 3.79% seeing a 2.35 % surge on the day, while the 2-year yield stands at 4.60% with a 2.02 % advance and the 5-year yielding 3.95% with a 2.37 % increase respectively giving additional traction to the US Dollar.
Earlier on Wednesday, the AUD/USD peaked at 0.6717, the highest level since May 11, despite weak Chinese data. The Australian Dollar was boosted by a hawkish tone from RBA Governor Lowe. However, Australian Q1 GDP data fell below expectations, with a quarterly expansion of 0.2% compared to the market consensus of 0.3%.
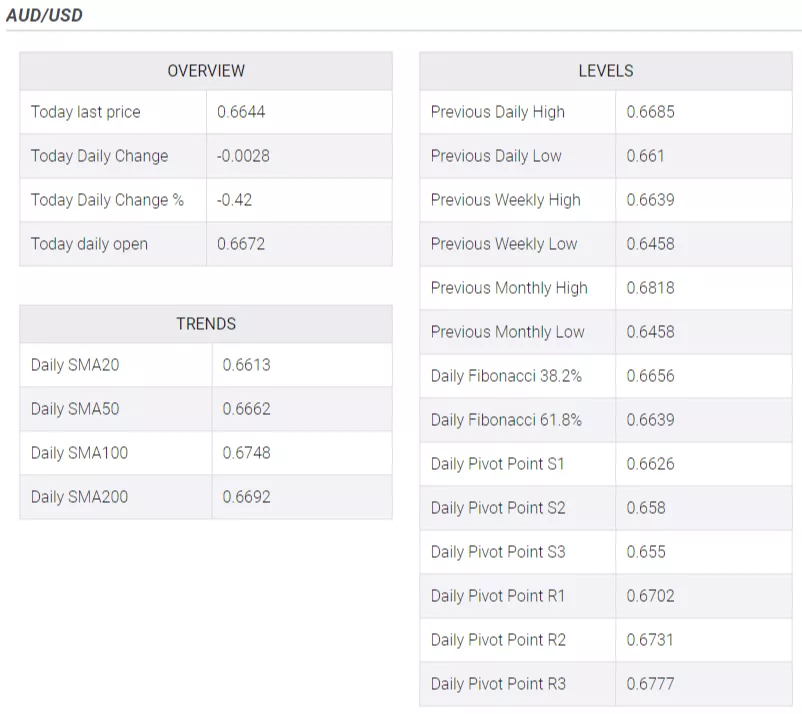
Levels to watch
Technically speaking, the AUD/USD holds a neutral to bullish outlook for the short term as the bulls are struggling to maintain their dominance, but technical indicators are still favorable, suggesting that the market may still have some upside potential.
In case the Aussie recovers momentum, the following resistance line up at the 200-day Simple Moving Average (SMA) at 0.6690, followed then by the daily high at 0.6715/20 and the 100-day SMA at 0.6743. On the downside, the next support levels to watch are 0.6640, followed by 0.6605/10 and 0.6575 (weekly low).
More By This Author:
USD/CAD Tumbles To Four-Week Lows Near 1.3320 After BoC Surprise Interest Rate Hike
EUR/JPY Bounces Off Few Pips From Multi-Day Low, Retakes 149.00 Mark
AUD/USD Price Analysis: Bulls In Action As RBA’s Surprise Rate Hike Trims RBA-Fed Policy Divergence


Comments
Log in or sign up to join the conversation.