EUR/USD Price Analysis: Faces Barricades Around 1.0780 As USD Index Rebounds
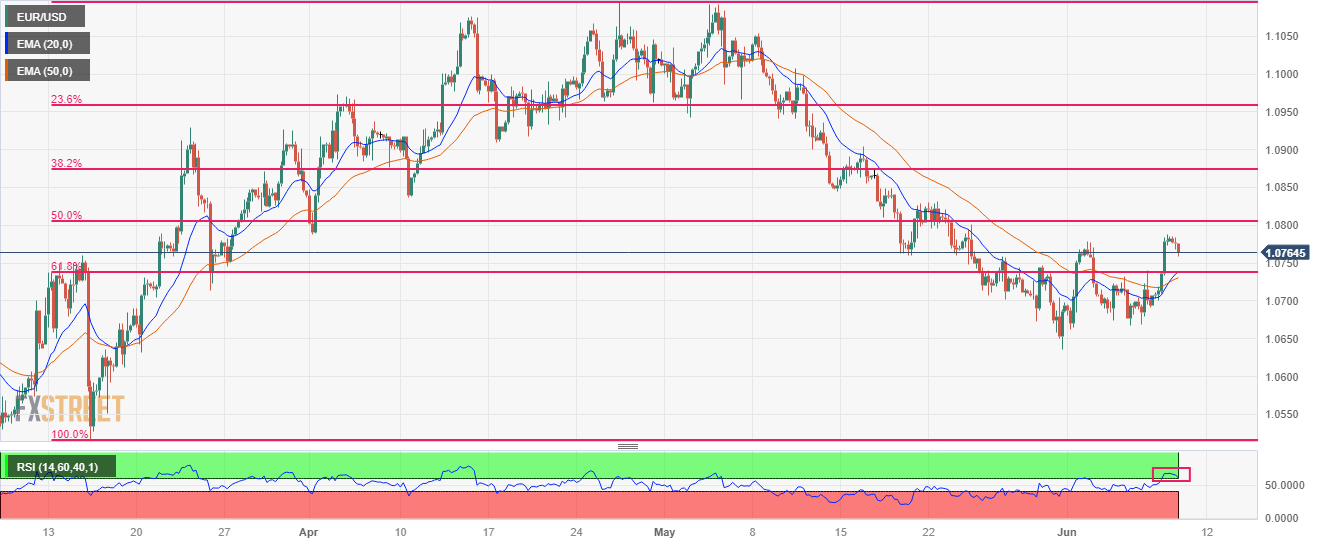
The EUR/USD pair has displayed an exhaustion in the upside momentum after reaching to near 1.0780 in the European session. The major currency pair has met an intermediate resistance due to an extension in the recovery by the US Dollar Index (DXY).
The USD Index has stretched its recovery to near 103.60, however, the downside seems favored as the United States labor market conditions are easing now and providing room for keeping interest rates steady by the Federal Reserve (Fed) in May.
A corrective move in the Euro could conclude sooner as the European Central Bank (ECB) is expected to raise interest rates further despite deepening fears of a recession in Eurozone.
The recovery move in the EUR/USD has pushed it above the 61.8% Fibonacci retracement (plotted from March 15 low at 1.0516 to April 26 high at 1.1095) at 1.0738. For a strong build-up of positive sentiment, the Euro has to pass through plenty of filters.
A bull cross, represented by the 20-and 50-period Exponential Moving Averages (EMAs) at 1.0724, adds to the upside filters.
Also, the Relative Strength Index (RSI) (14) has shifted into the bullish range of 60.00-80.00, which indicates that the upside momentum has been triggered.
Further correction to near May 30 high at 1.0746 would trigger a bargain buy opportunity, which will drive the asset towards June 02 high at 1.0779 followed by the round-level resistance at 1.0800.
In an alternate scenario, the downside move will resume if the shared currency pair drops below the June 05 low at 1.0675. This will drag the asset towards May 31 low at 1.0635 followed by March 03 low at 1.0588.
EUR/USD four-hour chart
(Click on image to enlarge)
EUR/USD
| OVERVIEW | |
|---|---|
| Today last price | 1.0763 |
| Today Daily Change | -0.0019 |
| Today Daily Change % | -0.18 |
| Today daily open | 1.0782 |
| TRENDS | |
|---|---|
| Daily SMA20 | 1.0764 |
| Daily SMA50 | 1.0887 |
| Daily SMA100 | 1.0809 |
| Daily SMA200 | 1.0516 |
| LEVELS | |
|---|---|
| Previous Daily High | 1.0787 |
| Previous Daily Low | 1.0696 |
| Previous Weekly High | 1.0779 |
| Previous Weekly Low | 1.0635 |
| Previous Monthly High | 1.1092 |
| Previous Monthly Low | 1.0635 |
| Daily Fibonacci 38.2% | 1.0752 |
| Daily Fibonacci 61.8% | 1.0731 |
| Daily Pivot Point S1 | 1.0723 |
| Daily Pivot Point S2 | 1.0664 |
| Daily Pivot Point S3 | 1.0632 |
| Daily Pivot Point R1 | 1.0814 |
| Daily Pivot Point R2 | 1.0846 |
| Daily Pivot Point R3 | 1.0906 |
More By This Author:
USD/JPY Plunges Amid U.S. Jobless Claims Rising, Japan’s Surprising GDP SurgeAUD/USD Rejected From 200-day SMA As USD Strengthens
USD/CAD Tumbles To Four-Week Lows Near 1.3320 After BoC Surprise Interest Rate Hike
Disclaimer: Information on these pages contains forward-looking statements that involve risks and uncertainties. Markets and instruments profiled on this page are for informational purposes only ...
more


