


USDJPY has finally turned sharply to the downside, likely following BoJ intervention. We have seen a strong decline from the 164 area, and because this move unfolded aggressively within a very short period of time, we assume that an important top is already in place.
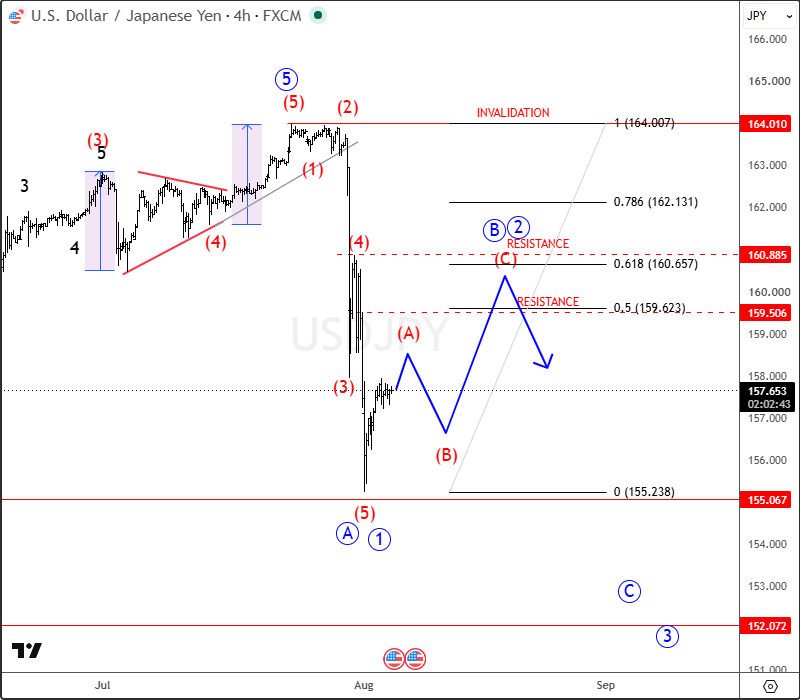
This view was confirmed after price broke below the trendline support extending from the triangle pattern and, more importantly, below the 162.65 support level. The market is now stabilizing and recovering from the 155 area, suggesting that wave (5) of the impulsive decline into wave A/1 may already be complete.
USDJPY now appears to be entering a higher-degree ABC corrective rally in wave B, or potentially wave 2 as part of a larger bearish sequence. This recovery could take some time to develop, with the first ideal resistance zone at 159.50–160.88. A stronger recovery could extend toward the 161–162 area, where sellers may return and resume the downside move within wave C or wave 3.
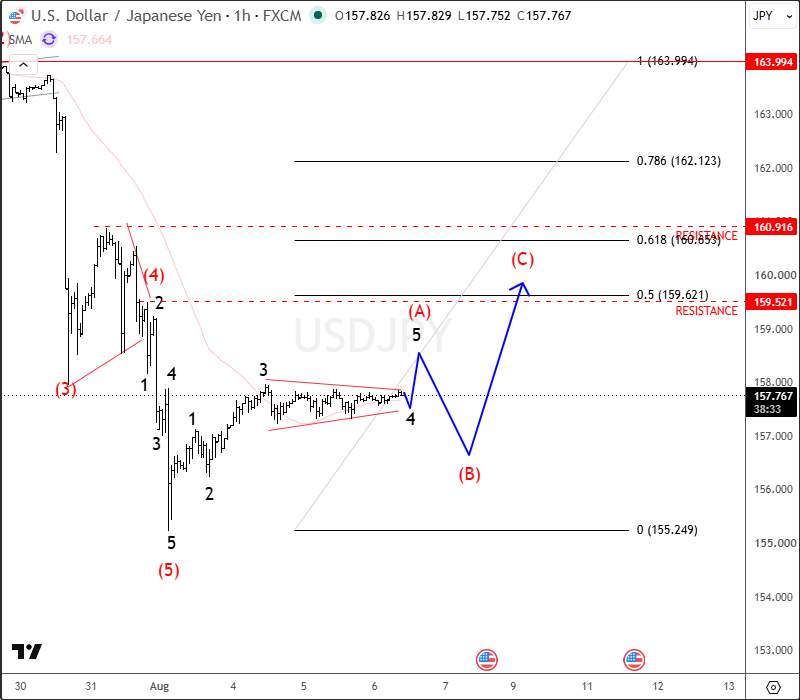
On the intraday 1H chart, USDJPY appears to still be forming, and potentially completing, a bullish triangle pattern in wave 4. Therefore, watch for one more push higher into wave 5 of (A), followed by a corrective pullback in wave (B), before a continuation higher within wave (C).


Comments
Log in or sign up to join the conversation.