

Inflation continues to make slow progress towards the target, leaving the possibility of a rate hike this year firmly in play, but consumer fundamentals remain soft due to flat-lining real incomes
Inflation is cooling, albeit slowly
July's US core PCE deflator, the Federal Reserve's preferred measure of inflation, has come in at 0.2%MoM/3.3%YoY, as expected. The headline inflation rate was a touch firmer than anticipated at 0.2%/3.7%, but that is OK. As long as the month-on-month rate continues to come in close to 0.2% MoM, the annual rate of inflation will converge on 2% over time, but the question is how much more patience the Fed actually has. Markets continue to price a 25bp rate hike before year-end while economists, in general, still favour an extended pause for policy rates.
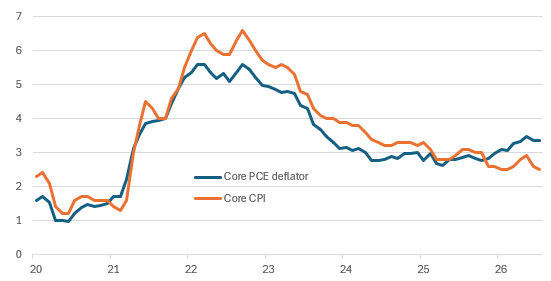
The chart below shows the year-on-year rate of inflation for the core PCE deflator and the core CPI. Core PCE is obviously tracking a little higher, but we are going to have some major changes to the calculation methodology next month surrounding insurance and portfolio management fees, amongst other things. With revisions coming through too, they should converge a little more. We continue to argue that tariff refunds, weak wage growth, softening housing rents and stability in energy markets will continue nudging inflation closer to 2% on both metrics over the coming 12 months, hence our view on stable Fed funds through well into 2027.
Core CPI versus core PCE deflator YoY%
Consumer fundamentals remain under pressure as spending stalls
Meanwhile, second-quarter GDP was unrevised at 1.5% quarter-on-quarter annualised growth. Real personal spending for July was 0.0% MoM, confirming the soft start to the quarter from the consumer despite real household disposable income doing OK, rising 0.4% MoM. This result is the savings ratio rising from 2.6% to 3%.
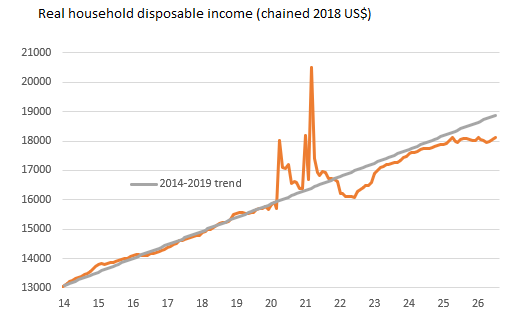
In terms of economic activity, the key story is real household disposable income – that is, incomes after tax and adjusted for inflation. It is the primary driver of spending power and suggests underlying consumer fundamentals remain under pressure. The chart below shows that RHDI has effectively flatlined for well over a year and is well below where the pre-COVID trend suggests we should be. Employment growth has been modest while wage growth has slowed and elevated inflation prints have eroded spending power. Tax changes (no tax on tips/overtime, etc), have not meaningfully improved the situation.
This is key to explaining the K-shaped consumer narrative. Middle and lower-income households are reliant on income to fund their spending and are under financial pressure – hence the low savings ratio of 3% versus the 6% long-run average and the fact that credit card and auto loan delinquencies are at or close to all-time highs. However, higher-income households have more spare capacity, with surging household wealth encouraging the top 20% of households by income to continue spending – remember the Federal Reserve states that the top 20% of households by income hold 70% of household wealth.
Real Household Disposable Income (2017 $bn)


Comments
Log in or sign up to join the conversation.