

Amid some cooling in consumer spending, investment linked to tech and AI has clearly become the main engine of growth in the US. Durable goods orders suggest this trend will continue through much of this year, but there are concerns that there is a lack of breadth to the overall US growth story.
Tech drives growth amid signs of cooling elsewhere
Lots of US data today with 1Q GDP growth coming in at 2% annualised versus the 2.3% consensus, the Federal Reserve’s favoured core inflation measure was in line at 0.3% month-on-month or 3.2% year-on-year while the employment cost index rose 0.9% quarter-on-quarter (consensus 0.8%) and initial jobless claims fell sharply to 189k (consensus 212k). As such, this paints a rather mixed picture of the state of the economy in the lead up to and early start of the Middle East conflict.
When looking at GDP, we have to remember that 2% growth follows a 0.5% outcome in 4Q 2025 – both of which were weaker than the market was anticipating. The government shutdown in October subtracted 1pp from headline growth in 4Q and the resumption added back 0.7pp in 1Q. Consequently, it is probably a good idea to take an average of the headline growth for the two quarters, which at 1.25%, is a notable slowdown on recent years.
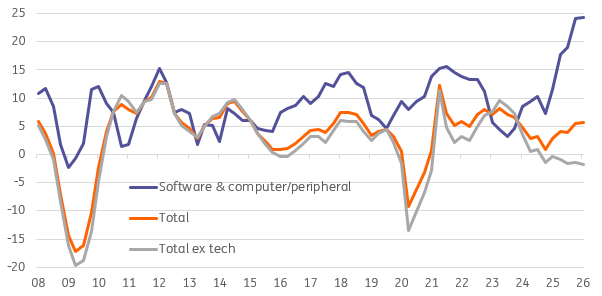
Consumer spending grew only 1.6% in 1Q after 1.9% in 4Q 2025 while on the investment front, residential contracted yet again. Meanwhile, a big rebound in imports led to net trade subtracting 1.3pp from headline GDP growth. In terms of business cape, we see the continuing theme of growth being driven by tech/AI. Software and computing investment rose 24% YoY while all other business capex has contracted for the sixth consecutive quarter. This looks unlikely to change with the latest durable goods orders showing orders for computers and electronics posting a 3.7% MoM increase in March, or 14% YoY.
Non-residential fixed investment (YoY%)
Steep drop in jobless claims contrasts with other data
The March personal income and spending report offers little over and above the GDP report, but it does provide the core PCE deflator measure of inflation, which rose 0.3% MoM, as expected. Meanwhile, the 0.9% QoQ rise in the employment cost index is a bit of a surprise. In the private sector, wages and salaries rose a modest 0.7%, but there was a 1.3% jump in benefits, which may in part be due to higher medical insurance premiums. A similar jump was also seen in benefits for government workers. As such, worker costs rose a little more, but the employees didn’t feel the financial benefit from it.
Finally, the hefty drop in initial jobless claims is an odd one. The Department of Labor publishes the numbers reported from the states but provides no explanation for the move. We know job loss announcements have increased from the Challenger, Gray and Christmas report, but it isn't translating into the claims numbers. One possible reason is that employers are simply pulling unfilled headcount or incentivising retirement right now. We would expect claims to start rising based on the demand indicators, but the effect of the immigration controls may also be contributing to this in an environment where several sectors are seeing shortages of workers such as food and construction.
Middle East conflict weighs on the outlook
So, the overall data suggests that the economy was in reasonably good shape in the run‑up to, and early stages of, the Middle East conflict. However, the longer disruptions to trade flows through the Strait of Hormuz persist, the stronger the headwinds to growth and job creation, and the greater the upside risks to inflation. Nonetheless, the lack of demand impetus in the consumer sector suggests that if a solution can be found and energy costs start heading lower, those inflation fears will swiftly recede, leaving us with the mindset that interest rate cuts remain more likely than interest rate increases.



Comments
Log in or sign up to join the conversation.