
Weekly Chart
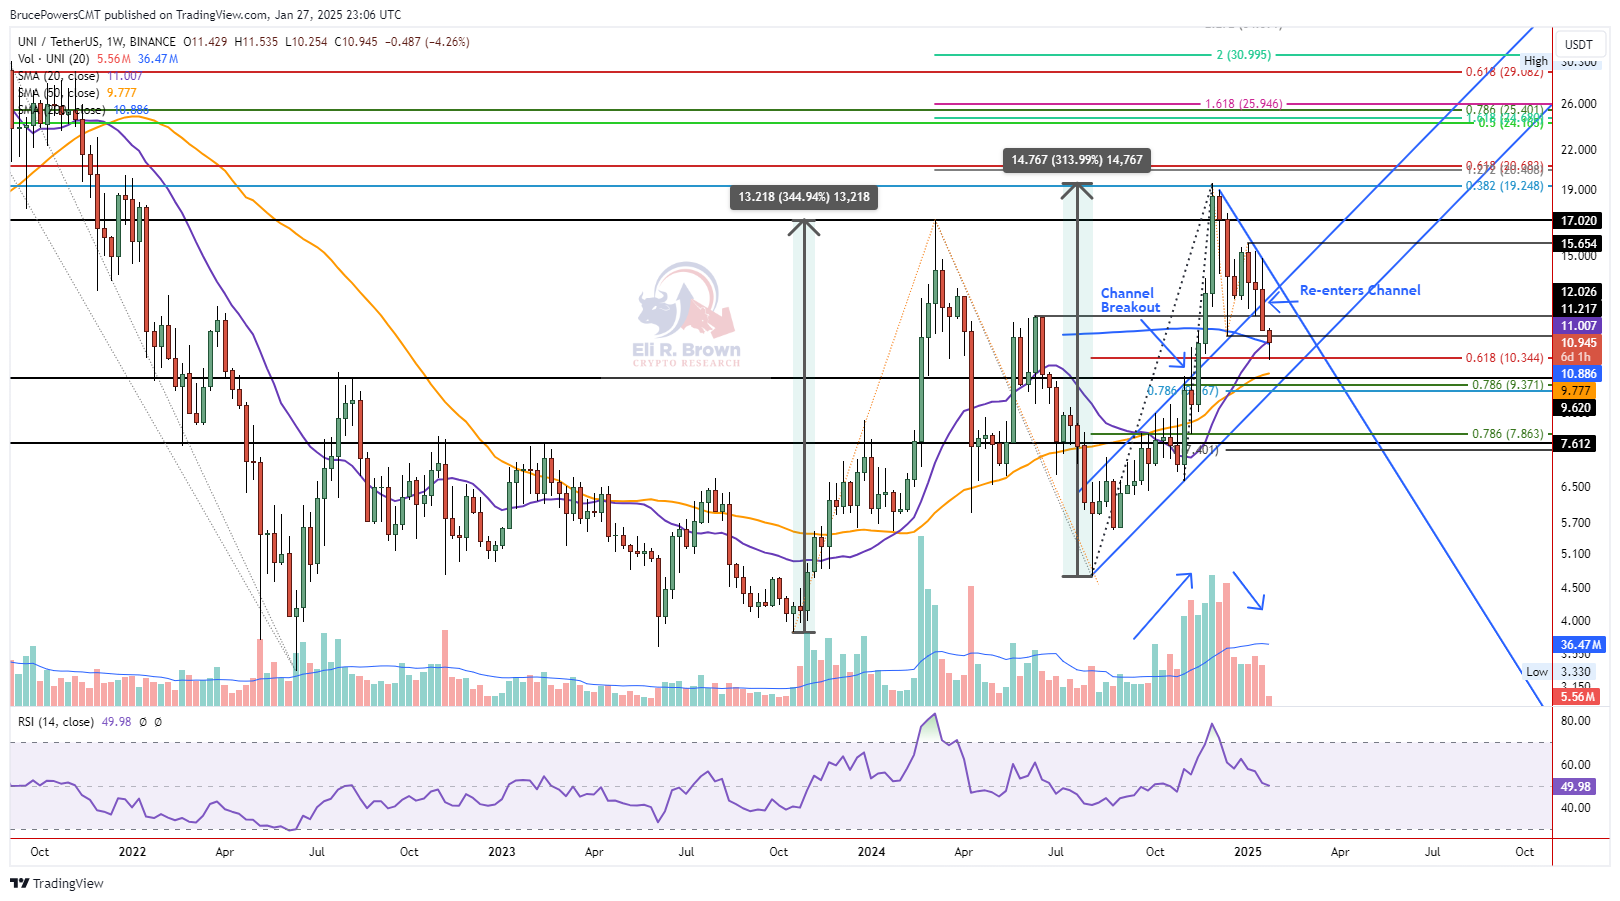
Observations - Weekly
-
Bull trend showed signs of strengthening as it triggered a higher swing high of $19.47 in early-December.
-
Subsequently, a trend high of $19.47 was reached on December 8, which led to the current bearish correction. Once the first bottom at $11.22 was established UNIUSDT formed a triangle consolidation pattern on support of top rising channel line (resistance becomes support). Notice that the light blue AVWAP around $12.87 was also in the area of support for the pattern.
-
Bear trend continuation triggered on Saturday with a drop below the lower boundary line at $12.39, followed by the of the triangle at $11.22, the initial swing low in the correction. Support seen today at a low of $10.34, thereby completing a 61.8% retracement.
-
Since UNIUSDT has reentered the range of the rising trend channel, there is the possibility it falls to the lower channel line before the correction is complete.
Daily Chart
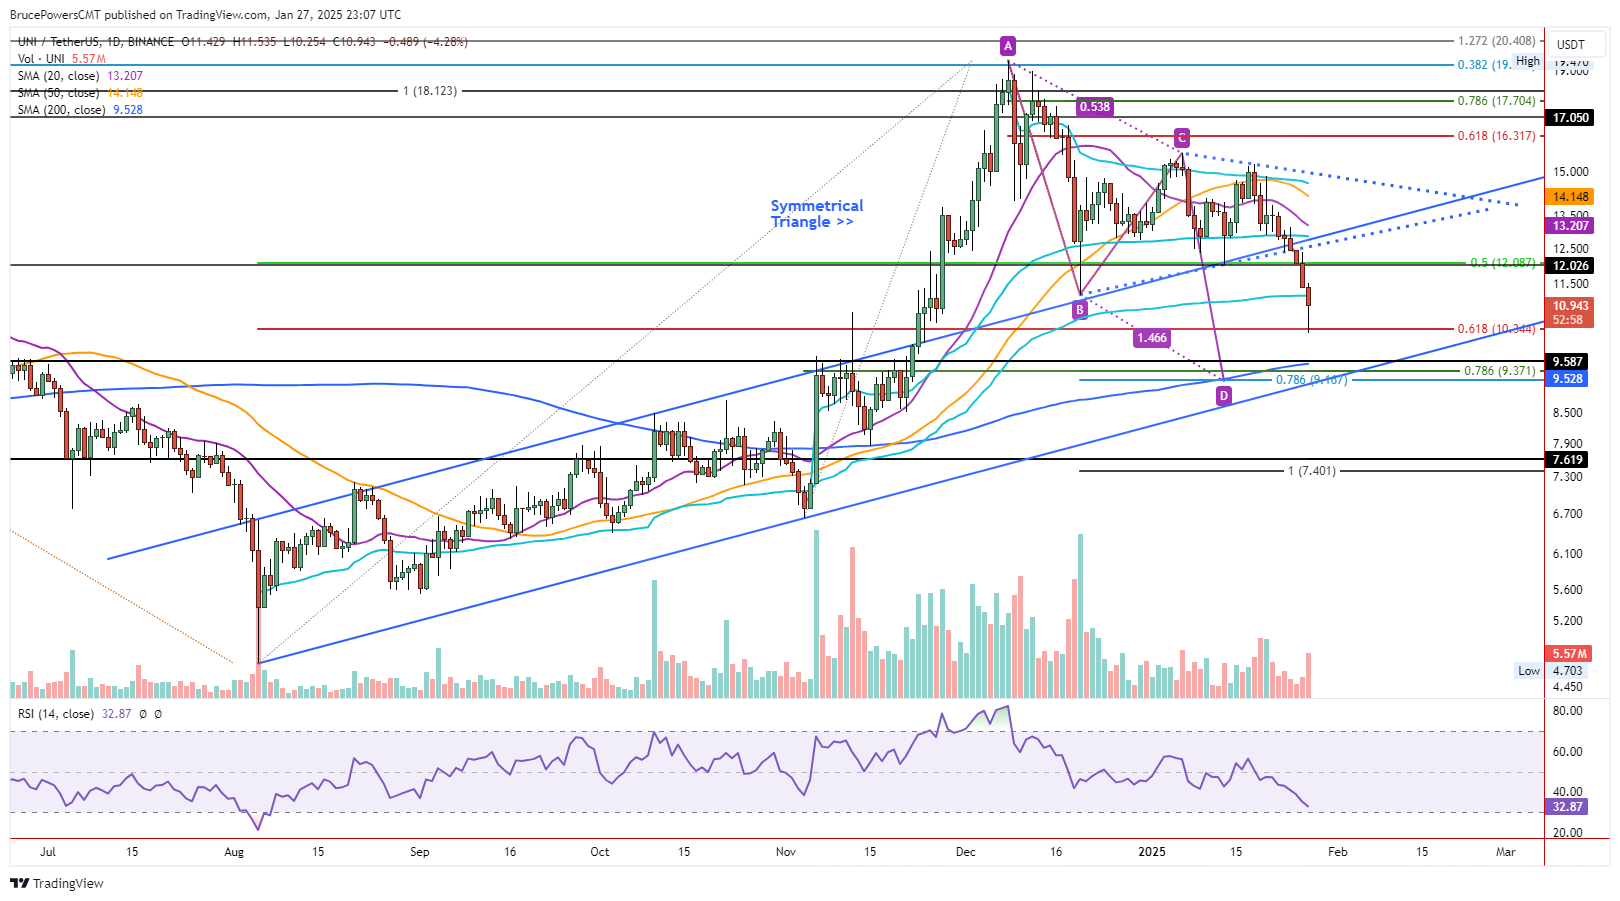
Observations - Daily
Lower Support
-
There is a potential lower support zone from $9.59 to the 200-day MA at $9.53. Also, the 78.6% Fibonacci retracement is slightly lower at $9.37 and a 78.6% (less than 100%) target for a falling ABCD pattern (purple) is at $9.17.
-
It is interesting to note that the AVWAP from the August bottom failed to hold as support during Monday’s drop.
Potential Resistance
-
Prior swing low from triangle pattern is at $12.02.
-
AVWAP from August low is around $12.88.
-
20-day MA is at $13.21 and the 50-day MA is at $14.15.
Bull Strategy
-
Wait for the trend to evolve and for a more significant potential support zone to be reached. Watch for signs of support around the 200-day MA and lower rising channel line and subsequent bullish reversal.
-
Anticipated rally back to the top channel line. An AVWAP level is at $12.88 today, close to converging with the channel line.
Bear Strategy
-
Watch for a rally into resistance at or below the top channel. Then, watch for a bearish reversal setup on the daily or lower time frame for a short and potential continuation of the bearish correction to the 200-day MA target zone.
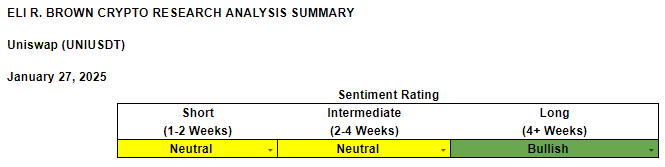
Sentiment Rating & Signals
More By This Author:
XRP (XRP/USD) Analysis Shows Bull Trend Intact
Bull Flag Breakout In SOL/USD Shows Strength
EUR/USD Double Bottom Breakout Begins


Comments
Log in or sign up to join the conversation.