XRP (XRP/USD) Analysis Shows Bull Trend Intact
Weekly Chart

Observations:
-
Current Price Context
-
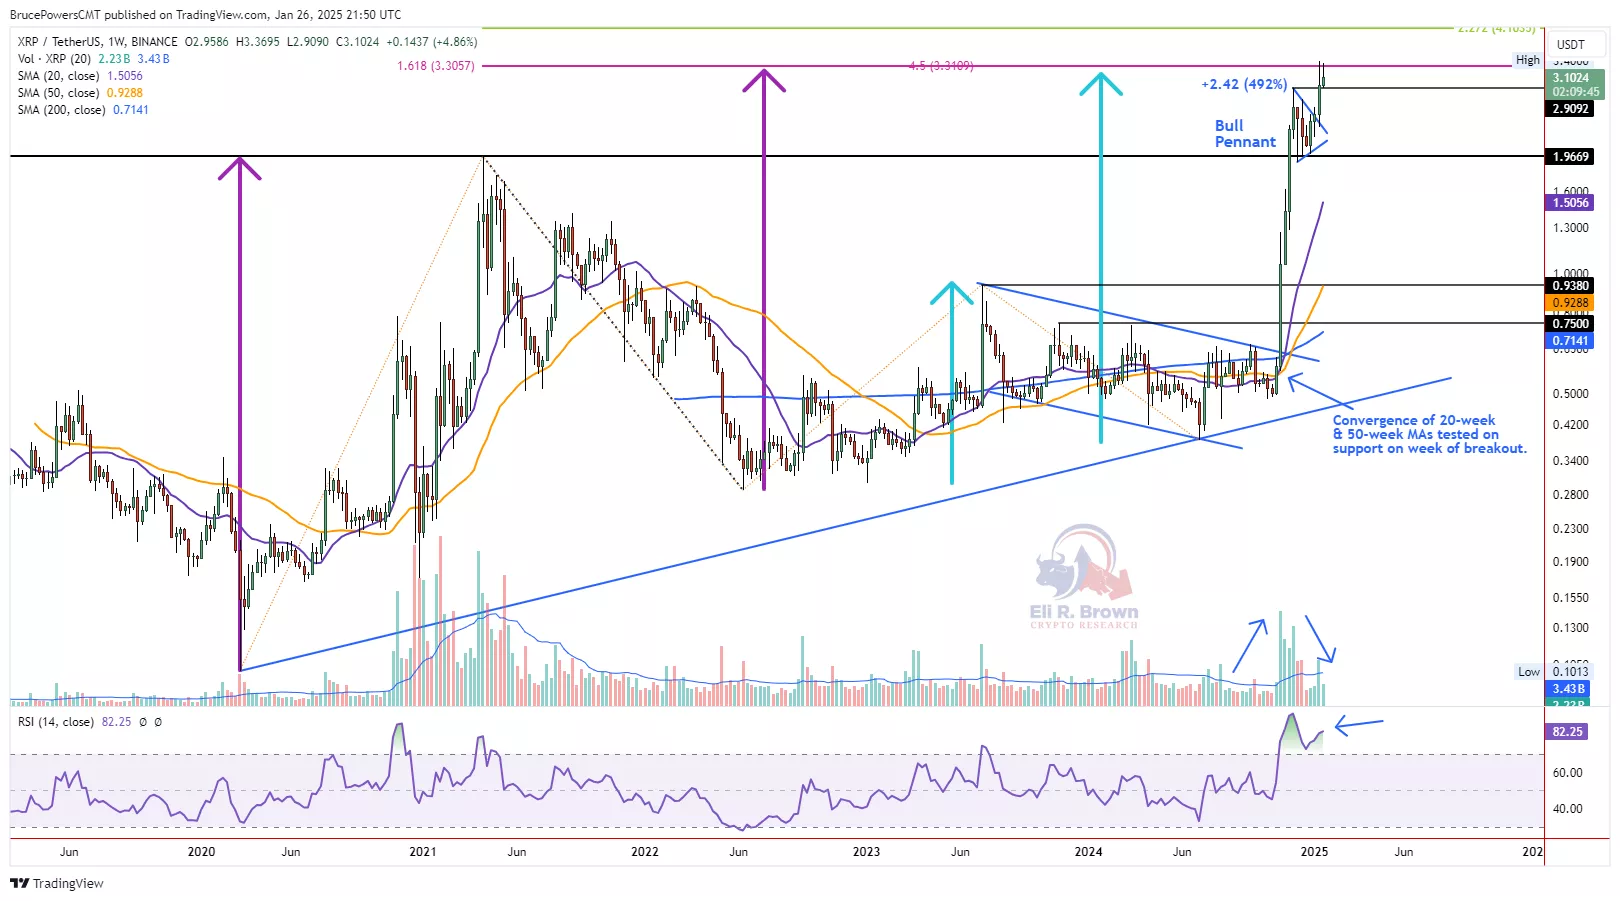
Long-term bull breakout of descending channel triggered in mid-November leading to a $2.42 (492%) spike rally high of $2.91.
-
Concurrent breakout above 200-week MA further confirmed strength and it followed a successful test of support earlier that week at the convergence of both the 20-day MA and 50-day MA.
-
-
Following the $2.91 high XRP/USD formed a bull pennant and an upside breakout triggered on January 11, leading to a trend high of $3.40.
-
This is a decision area as the $2.91 high completed two measured moves around the high. The rising purple arrows show a second measured move that extends the price distance in the first move by the 161.8% Fibonacci golden ratio. More recently, the light blue rising lines show the current move reaching 4.5x the initial rally at the current high.
-
-
-
Two possible scenarios
-
Either strength is retained leading to a continuation of the bull run with a breakout to new highs above $3.40, or a pullback to test potential support levels occurs first.
-
Bull pennant breakout following a significant rally implies higher prices and continued strong momentum overall in XRP/USDT.
-
Next upside targets are $4.10, $4.53 and $4.64 on the weekly chart.
-
-
Weekly support
-
Begins with this week low at $2.91. It is an inside week showing relative strength as it has formed around the top third of last week’s price range. Otherwise, watch the prior trend high at $2.91 and $2.60 for signs of support.
-
Daily Chart - Trade Idea

Entry Strategy
-
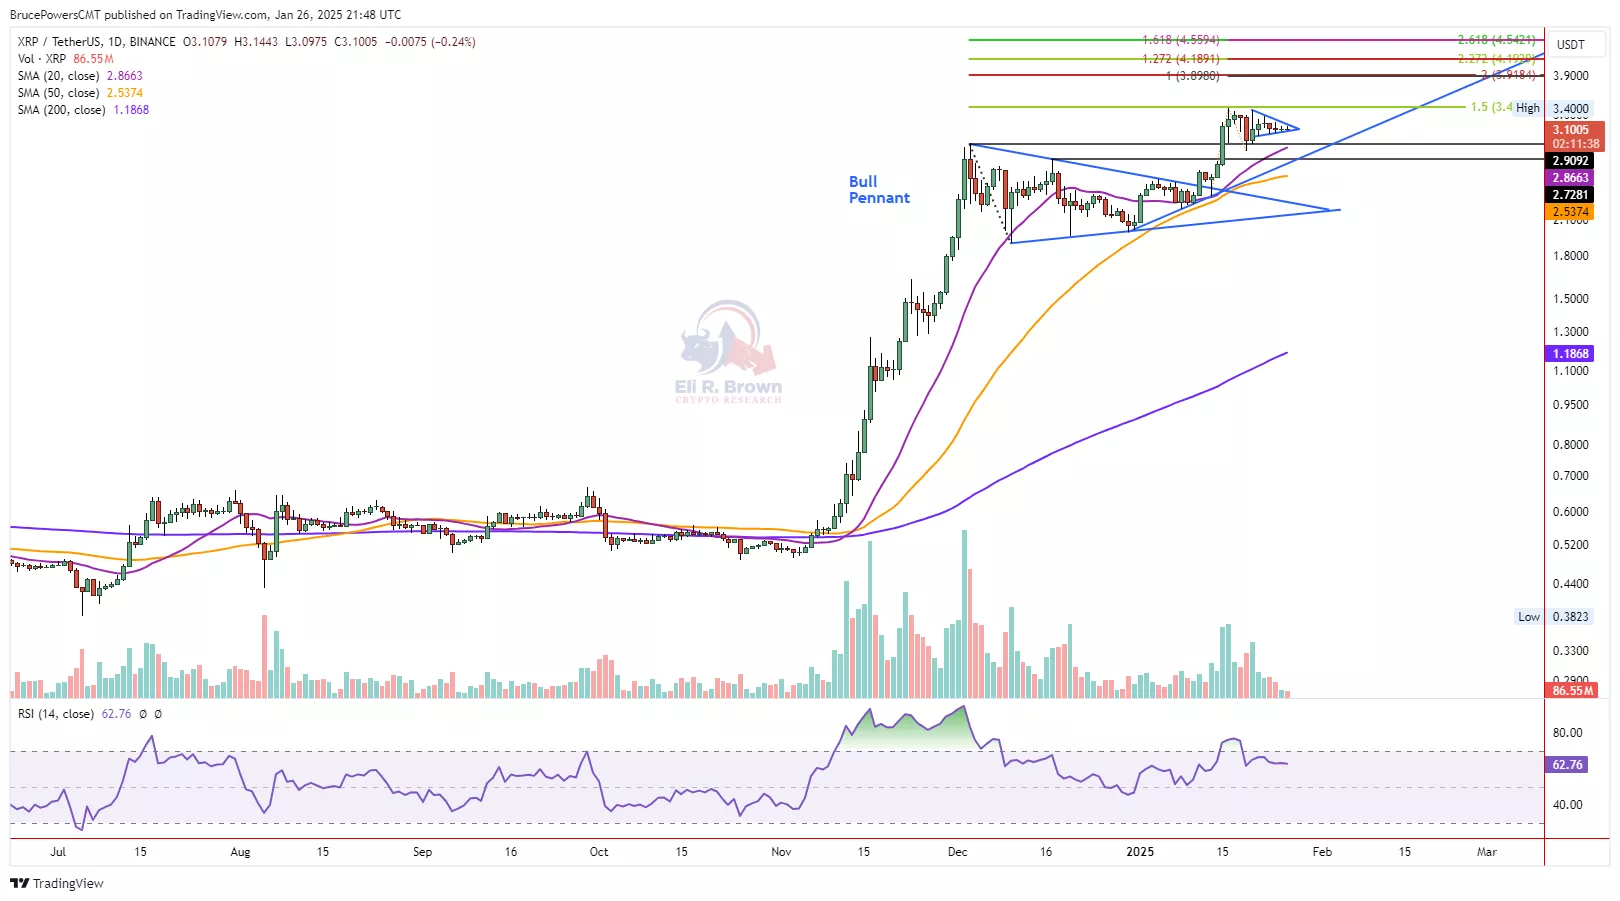
Tight consolidation formed following $3.40 trend high. Looking for early sign of strength on breakout of tighter range in recent days.
-
Enter on breakout above four day high of $3.19 ($3.24).
Risk Management
-
Initial stop below support of tight range at $3.06.
Target Levels
-
Take-Profit 1: $3.86
Target includes convergence of two indicators-
Reward: $0.62
-
R:R: 3.4x
-
-
Take-Profit 2: $4.15
Reaches second confluence zone.-
Reward: $0.91
-
R:R: 5.1x
-
Trade Idea #2
Wait for a possible deeper pullback to occur and subsequent bullish reversal setups on intraday time frames off potential key support areas. That would be around the 20-day MA at $2.87 currently, along with the small uptrend line. Further down is prior resistance at $2.51 along with the 50-day MA at $2.53 so far.
Sentiment Rating & Signals

Thanks for reading!
More By This Author:
Bull Flag Breakout In SOL/USD Shows Strength
EUR/USD Double Bottom Breakout Begins
EUR/USD At Potential Support That May Lead To A Rally
Disclosure: Above analysis is for educational purposes only. Proceed at your own risk. All information given here is largely based on technical analysis and the analysis is very dynamic in nature and ...
more


