

Image Source: Pexels
SOL/USD broke out of a bull flag formation last week and ended the week strong. It managed to exceed the prior trend high of $209.90 and reach a high of $215.62. This week, it continued to strengthen, although on a relatively narrow range week, reaching a high of $225.37. That put the pair above the 88.6% Fibonacci retracement level at $215.41. Notice that the prior trend high was a little short of that retracement level but close enough to be valid, particularly given the subsequent bearish reaction.
(Click on image to enlarge)
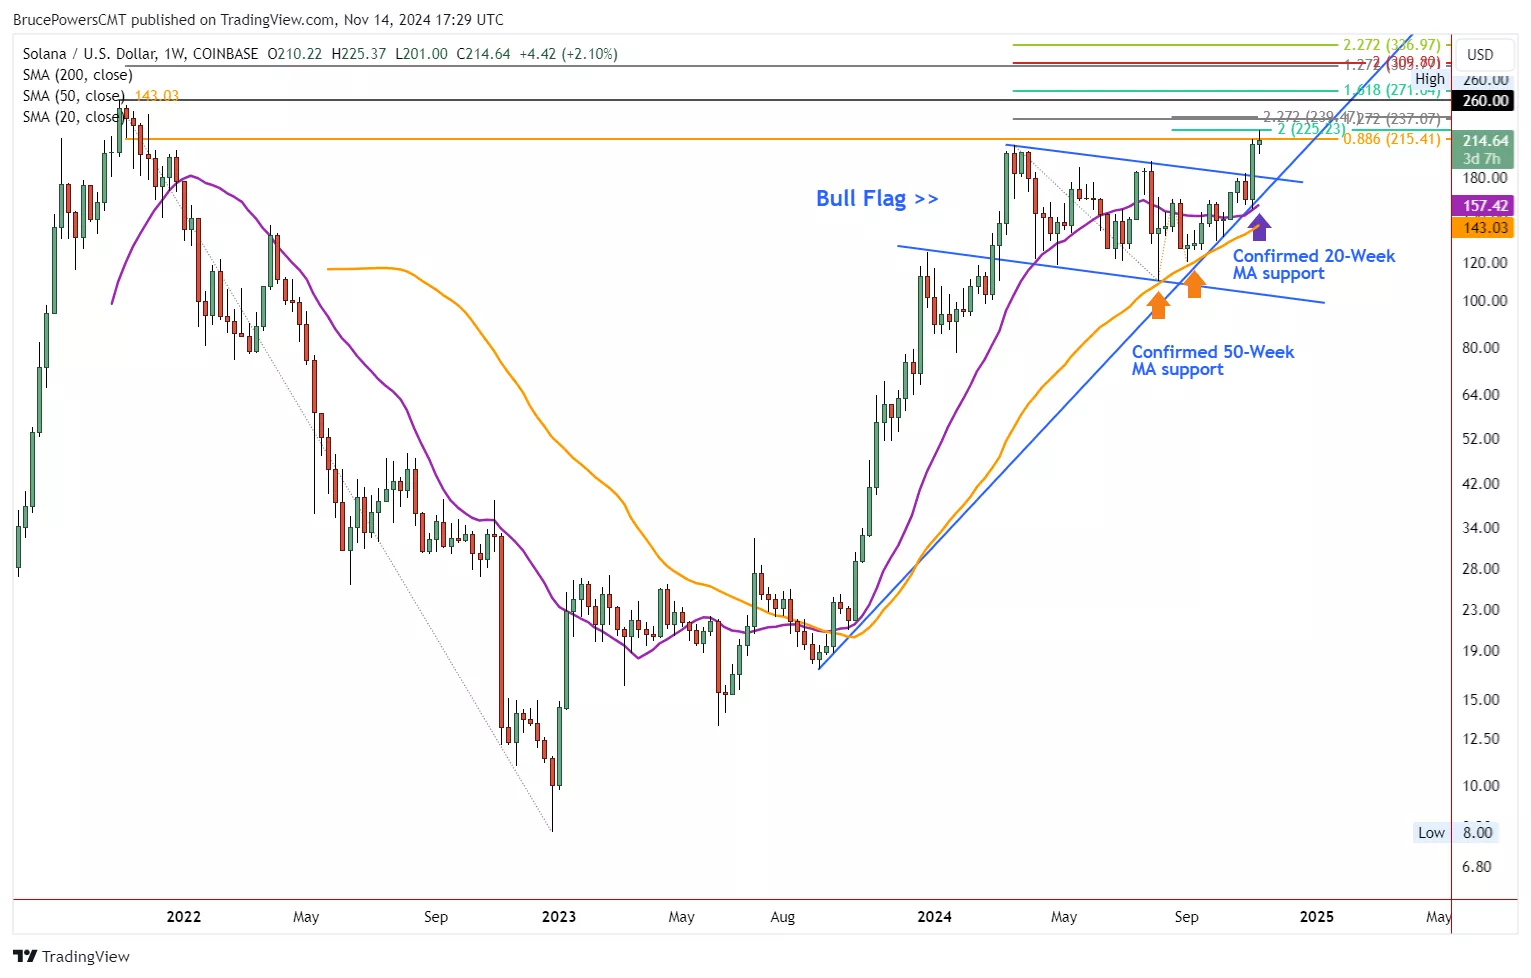
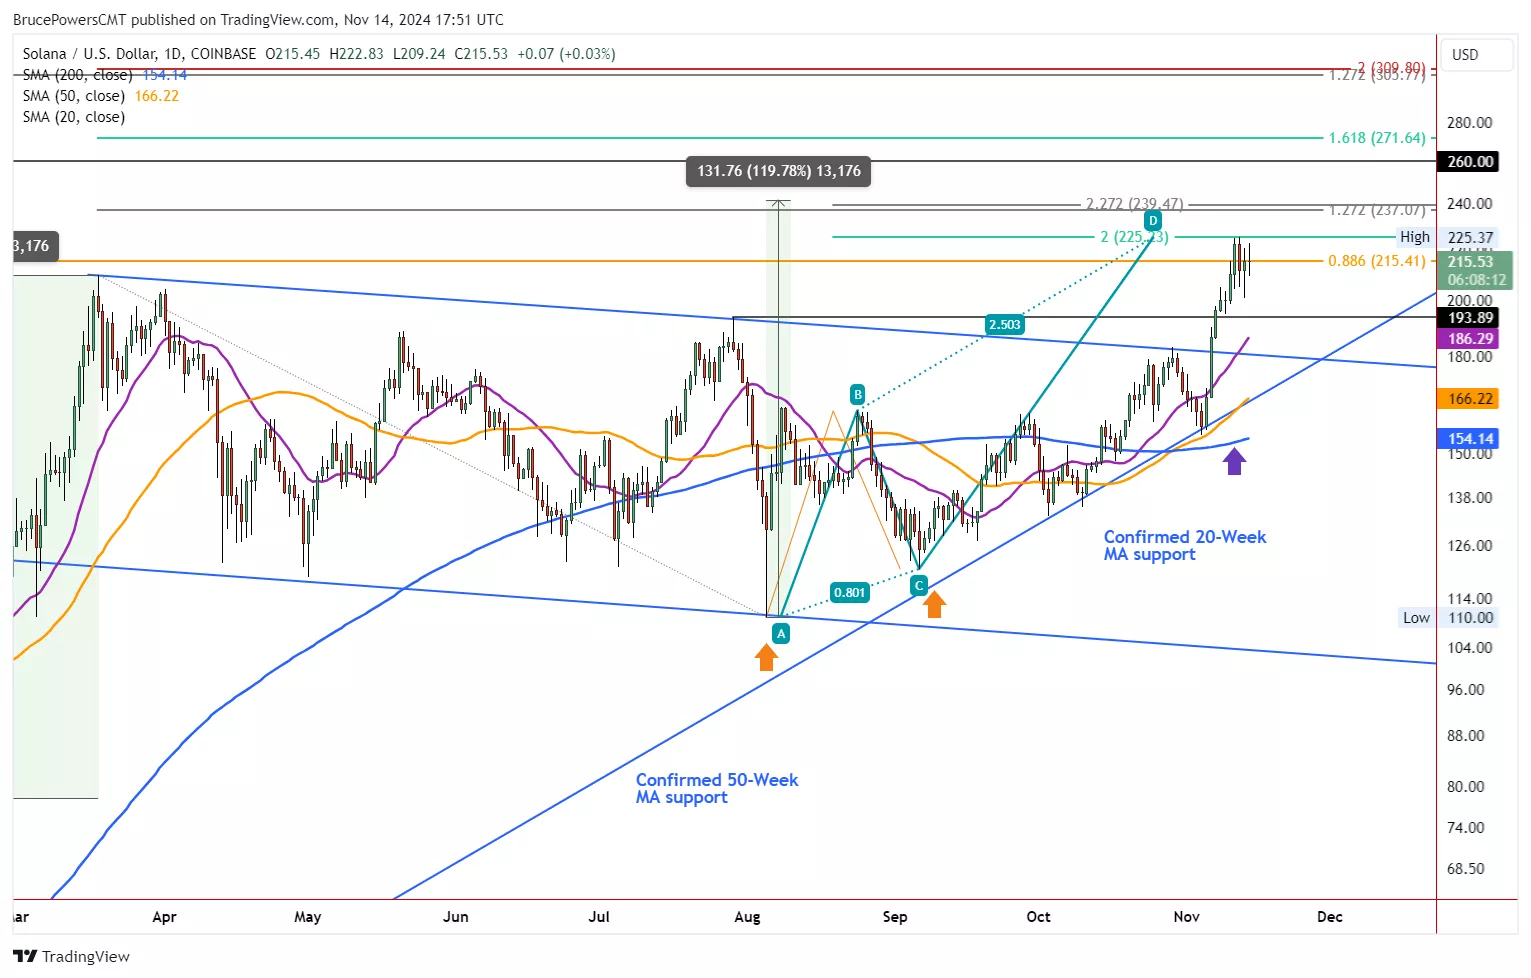
The first chart is the weekly time frame. It clearly shows the development of the bull flag. Notice that the orange 50-Week MA was successfully tested as support on a couple dips during its formation. This was eventually followed by a successful test of support last week at the purple 20-Week MA. That was the low before the bull breakout. On the daily chart it was the 50-Day MA that was tested. It is not unusual to see a test of a key moving average support prior to an accelerated move and it provides an additional indication that the breakout has a good chance of following through to the upside.
Notice that this week’s high completed a 200% extended rising ABCD pattern. So far it has indicated resistance and could lead to a pullback. If a deeper pullback develops, potential support levels include the prior swing high at $193.89 and the breakout area of $183.30. Further, the 20-Day MA is at $186.27 and may see signs of support.
(Click on image to enlarge)
Given the obvious bullish move, SOL/USD will likely be on many traders watchlists. That should help to retain strong demand during a pullback. An initial upside target is at the 127.2% extended retracement of the decline that began from the March peak of $209.90. That level is further identified by a measured move. Notice that the current rally that began from the August swing low matches the advance seen in the January rally in a similar price area. If the $260 record high can be exceeded, SOL/USD looks to be heading towards the 161.8% extension of the same decline at $271.64.
More By This Author:
EUR/USD Double Bottom Breakout Begins
EUR/USD At Potential Support That May Lead To A Rally
Bearish Shooting Star Shines

Comments
Log in or sign up to join the conversation.