

July inflation came in lower than expected, helping annual inflation continue to ease. However, price pressures were widespread, leading to a pickup in underlying monthly inflation.
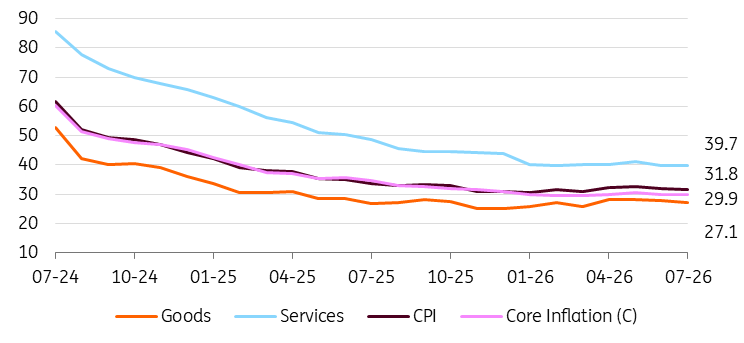
Monthly inflation in July was 1.8% vs the market consensus of 1.96%, while annual inflation maintained its downtrend to 31.8% (vs the Central Bank of Turkey’s target of 24% and forecast of 26% in the latest inflation report) from 32.1% a month ago. Despite unprocessed food and administrative prices pushing inflation higher, softer inflation in several non-food categories drove the downside surprise.
Core inflation (CPI-C) rose by 1.8% MoM and remained close to the level recorded last year, leading to an increase in the annual rate to 29.9%. However, the central bank's exchange rate policy, which has allowed only a modest depreciation of the lira in recent months, has kept core pressures in check. In other words, while the average increase in the USD/TRY stood at 1.7% in July compared to the previous month, its annual increase remaining at around 17% – significantly below inflation in the same period – indicates that the CBT maintains its exchange rate policy, which continues to support the disinflation objective through the cost channel.
In July, PPI stood at 1.5% MoM and fell to 27.8% YoY, the lowest in the last five months, while more than half of the monthly increase was driven by electricity and gas production. Global commodity prices and particularly oil prices in the current geopolitical backdrop will remain the key risk factors to the PPI, which is on a gradual uptrend.
Preliminary seasonally adjusted data, set to be published by TurkStat and closely monitored by the CBT, indicate that the seasonally adjusted headline CPI showed an acceleration in the headline to above the 2% level again, as the CBT highlighted a temporary uptick in the July inflation trend in the last MPC statement.
Evolution of annual inflation (%)
A breakdown of the data shows that:
The transportation group made the largest contribution to the headline figure (0.44ppt), driven by gasoline prices following the spike in oil prices due to re-escalating tensions in the Middle East, in addition to contributions from transportation services.
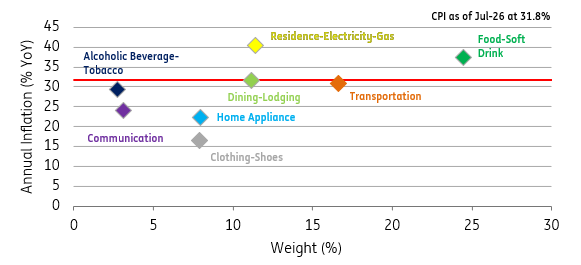
The food group was another contributor (0.40ppt) thanks to a pronounced 2.4% MoM rise in unprocessed food prices vs a 2.4% drop last year. However, processed food showed a benign change at 1.0% MoM, which limited the negative impact from the unprocessed side. Accordingly, annual inflation inched up to 37.5% vs the CBT’s assumption for this item of 26.3% for this year.
The health group followed (0.32ppt) with a significant mid-year increase in co-pay charges as the government delayed some of the January adjustments this year.
Finally, housing attributable to electricity prices and catering services were other major groups with a monthly impact on the headline around 0.25-0.30ppt.
On the flip side, the clothing group dragged the headline (-0.28ppt) with seasonal factors, though the monthly price decline remained below the drop recorded last year. Annual inflation in this group has been on a rising path since the end of 2025, with an increase from 5.8% to 16.2% most recently.
As a result:
Goods inflation fell slightly to 27.1% YoY, while core goods inflation moved down to 16.8%, remaining subdued given the CBT’s tight grip on the exchange rate supporting disinflation in this group.
Services inflation has remained elevated at 39.7.1% YoY, showing the extent of inertia, while rents fell further with gradual normalisation continuing for more than two years.
Annual inflation in expenditure groups
Overall, better-than-expected July CPI data helped maintain a downtrend in the annual figure, though pricing pressures were relatively broad-based, with the impact of geopolitics, administrative hikes and unprocessed food leading to an increase in the seasonally adjusted monthly inflation.
Uncertainty surrounding oil prices – along with their spillover effects on other commodity prices – continues to pose risks to the inflation outlook, while the government’s decision to gradually unwind the sliding scale mechanism adds to the challenges. The resumption of the Iran-US peace process, on the other hand, would ease geopolitical tensions and help oil prices return to prewar levels, which in turn would be supportive for the inflation outlook.
Against this backdrop, the CBT’s inflation report release on 13 August may provide further insights about the timing of the expected easing in liquidity conditions, given US President Trump hinted that an agreement on reopening the Strait of Hormuz could be reached soon.


Comments
Log in or sign up to join the conversation.