

That’s what BLS data shows. Believe it?
A couple of Tweets caught my eye today on male vs female employment.
Employment Level Detail in Thousands
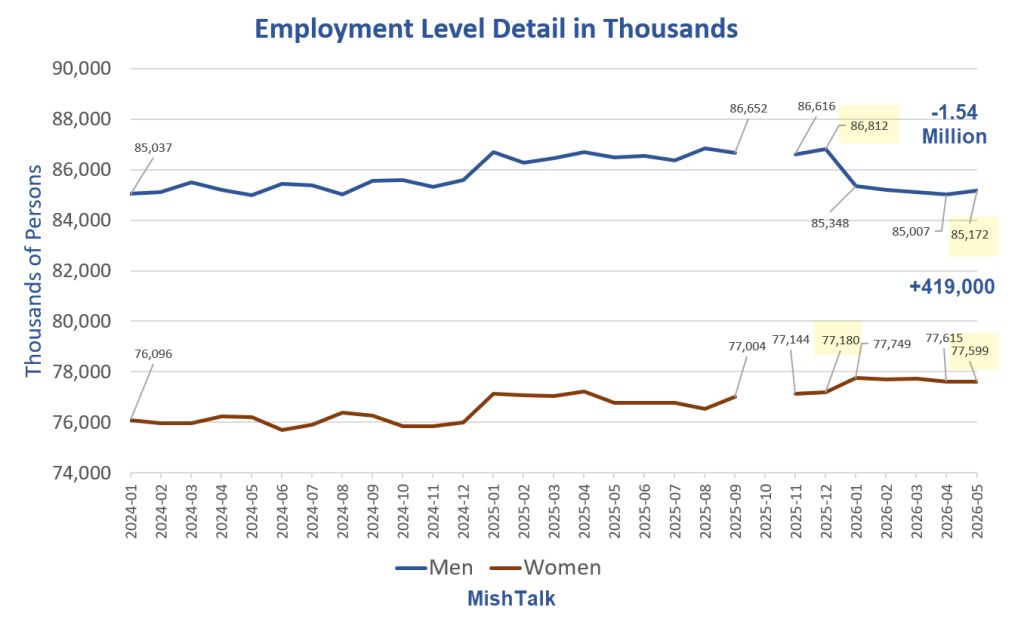
BLS Employment Level Details, Mae and Female Employment
Employment Details Since December 2025
Male Employment Down 1.54 million
Female Employment Up 419,000
That’s what the data shows. But some are skeptics.
What’s Going On?
Professor Plum asks “Does anyone have any ideas of what could be going on? /S”
“/S” Is Sarcasm.
Change in Employment Level in Thousands
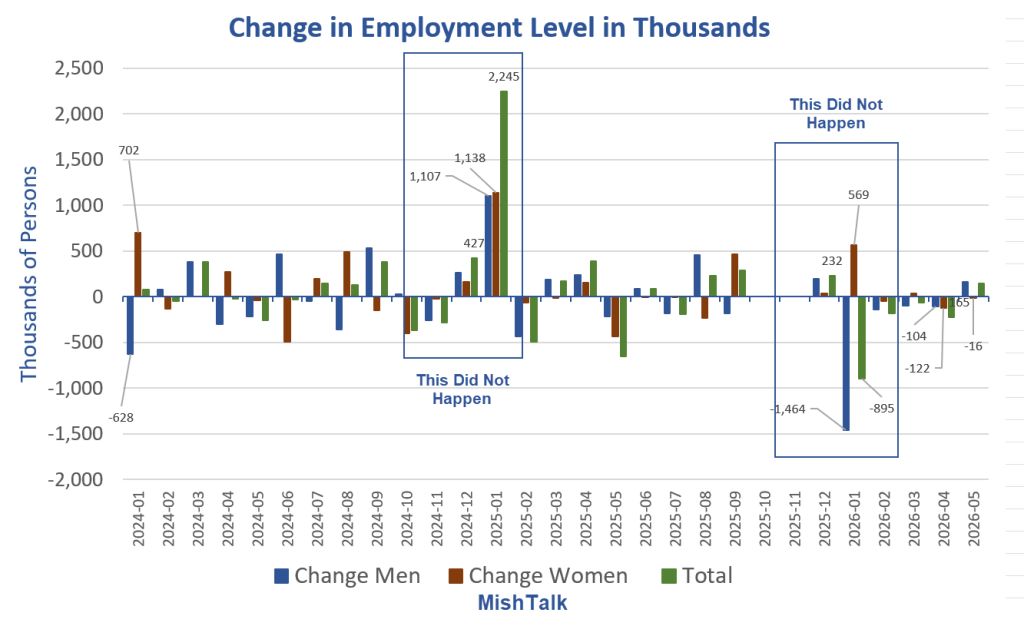
BLS Change in Employment Levels
What Did “Not” Happen
Employment did not suddenly rise by 2.245 million in January of 2025.
Employment did not suddenly fall by 895,000 in January of 2026.
The male/female breakdowns of the above also did not happen.
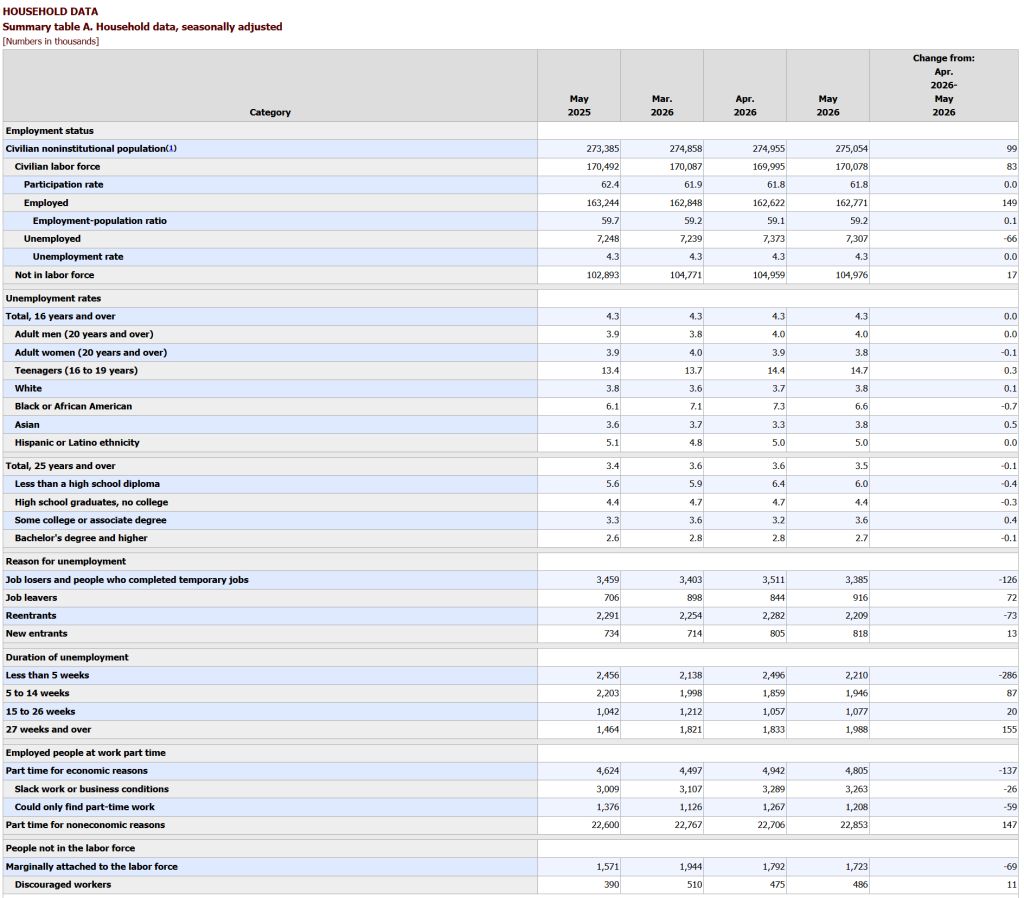
All Household Data Numbers Are Wrong
Repeat after me “All the Standard Household Data Numbers Are Wrong”.
I have been commenting on this for years, every month.
Since the household numbers are wrong, stop believing them. The BLS does not believe them either. They just refuse to correct their charts because it’s their usual practice.
BLS Statement: “(Official CPS estimates for December 2025 and earlier months have not been revised, in accordance with usual practice.)” CPS stands for Current Population Survey.
What the BLS is saying: The standard data series is totally effed, and we know it, and we won’t correct it, but if you know where to look, you can find better numbers.
Let’s take a look at my latest jobs report, including comments that I repeat every month.

Please consider Jobs Rise a Better than Expected 172,000 in May, Unemployment Rate Steady
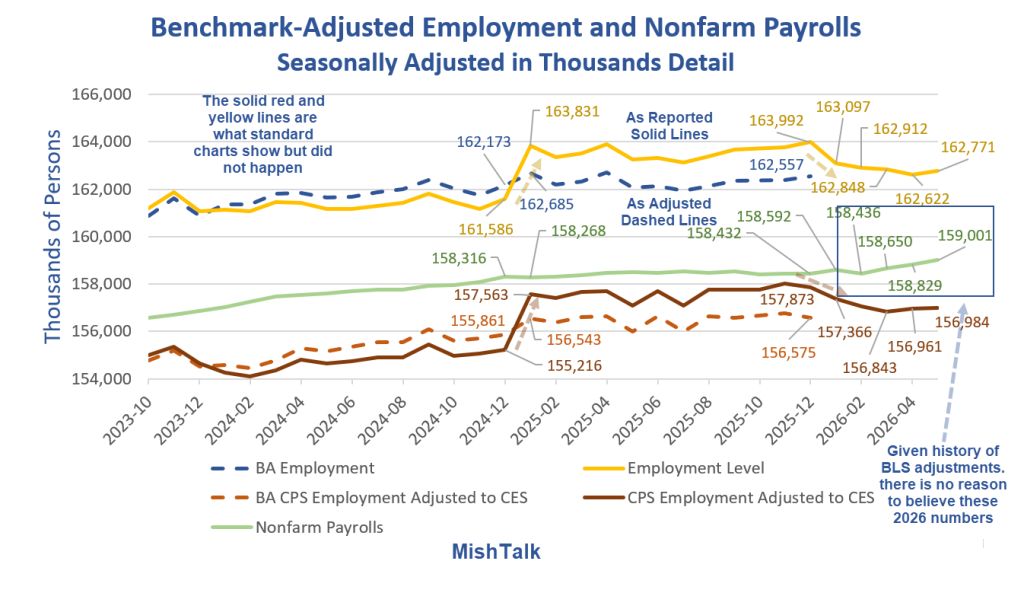
Understanding the Lead Chart [The Preceding Chart]
If you have seen this explanation, please skip to down to the subtitle “My Charts” to continue reading.
Every January (typically), the BLS has annual revisions to nonfarm payrolls and household population employment. The BLS does not back revise the household charts.
Because the BLS does not back revise, we see ridiculous numbers such as employment rising by over 2 million in a month (first yellow arrow).
To correct for the population adjustments, the BLS provides an adjustment series to normalize employment levels to match nonfarm payrolls. The BLS calls this “experimental” data but the regular posted data is admitted nonsense.
The experimental series is LNS16000000, “Employment Adjusted to CES Concepts“.
We did not suddenly add 2.245 million jobs in January of 2025, all US-Born. (Difference between the dashed blue line and the yellow line).
Moreover, there is no valid historical data on full vs parttime employment, on foreign born employment, and many other BLS data series.
All posts on foreign-born employment, parttime employment, etc., suffer this flaw. All year-over-year (or December-to January) analysis you find on these stats is permanently flawed.
2025 Experimental Data
In April, the BLS released Experimental series accounting for January 2026 population control effects.
(Official CPS estimates for December 2025 and earlier months have not been revised, in accordance with usual practice.)
Experimental Series
In 2025, BLS produced new experimental time series measures to account for the size and timing of the large population changes reflected in the January 2025 population control adjustment.
The experimental series use the monthly time series (back to April 2020) available from the Census Bureau’s Vintage 2025 population estimates that form the basis of the January 2026 CPS population control adjustment.
The experimental series are smoother over time, as they do not show the annual effects of the population control adjustments that occur each January in the official series.
The experimental series adjusts data back to April 2020, the decennial census reference point.
All standard year-over-year household data comparisons are nonsense. Comparisons between January and December of the prior year are also invalid.
My Charts
I will continue to use what the BLS refers to as “experimental data” because the official series household data is admitted nonsense.
Making Things Simple
All BLS historical Household Data on all standard charts is invalid.
Q: What’s included in that statement?
A: Employment levels, Unemployment Rates, Full Time Jobs, Part Time Jobs, everything, to varying degrees.
Employment numbers are much worse than the rest.
Household Data
All historical references to any of those items is, to varying degrees, nonsense.
Q: Is anything missing from the above list.
A: Yes, notably foreign born employment.
Foreign Born Employment numbers are even worse than employment levels because the numbers are not seasonally adjusted and they should be.
And foreign born employment numbers are not in the experimental data.
That means all references to foreign born employment, even month-to-month current year are invalid.
Otherwise, excluding comparisons of January to December of the prior year, month-to-month comparisons are valid until the next annual Benchmark Revisions in January.
But we have had two huge revisions back-to-back.
The BLS first understated employment then overstated it.
BLS Issues
Undercounting then overcounting illegal immigration
Missing economic turns
Sampling procedures
Sampling rates
Are illegals claiming unemployment? Even answering the phone?
What About the Establishment Survey?
The Establishment Survey (the headline jobs number) has it own set of issues.
Those issues include a questionable Birth-Death model, sampling procedures, and sampling rates.
There is no reason to believe any of this. That’s a statement I make every month.
What Is Believable?
The Quarterly Census of Employment and Wages (QCEW) and Business Employment Dynamics (BED) reports are believable.
BED is a very large subset of QCEW.
QCEW vs CES (Current Employment Statistics – Establishment Survey Jobs)
QCEW: A near-complete census of approximately 12.3 million U.S. business establishments. It tracks jobs and wages covered by Unemployment Insurance (UI).
CES: A monthly sample survey of about 400,000 businesses and government agencies. It provides preliminary estimates of employment, hours, and earnings.
Response Rates
The Quarterly Census of Employment and Wages (QCEW) boasts a highly comprehensive reporting rate of over 90 to 95%, because it relies on mandatory state unemployment insurance (UI) tax records.
In contrast, the monthly Current Employment Statistics (CES) is a voluntary establishment survey and has seen its response rates decline to roughly 43%.
So, it’s 43 percent of 400,000 (perhaps weighted improperly) vs 90-95 percent of everything.
There is also reporting bias. Businesses doing well are more likely to respond than struggling businesses. And large businesses are more likely than small businesses to have someone dedicated to responding to government surveys.
A big problem with QCEW is the 5 month lag. So, everyone latches on to bogus monthly numbers for the mandatory instant gratification.
Three Things Guaranteed Invalid
Making year-over-year assessments with standard household data
Making December-to-January month-over-month assessments with household data
Doing anything at all with foreign-born employment numbers.
Some data is much worse than others.
For example, unemployment rates vary little between the adjusted data and the standard data (4.6% experimental in Nov 2025 vs reported 4.5%).
Employment levels and job levels are the most suspect. Foreign born employment is the worst.
There is no adjusted employment data but not for male and female employment or full vs part-time employment.
There is no good reason to believe any of this.
It’s possible the economy added 172,000 jobs in May. Just color me skeptical.


Comments
Log in or sign up to join the conversation.