

The US copper stockpile is the biggest in history.
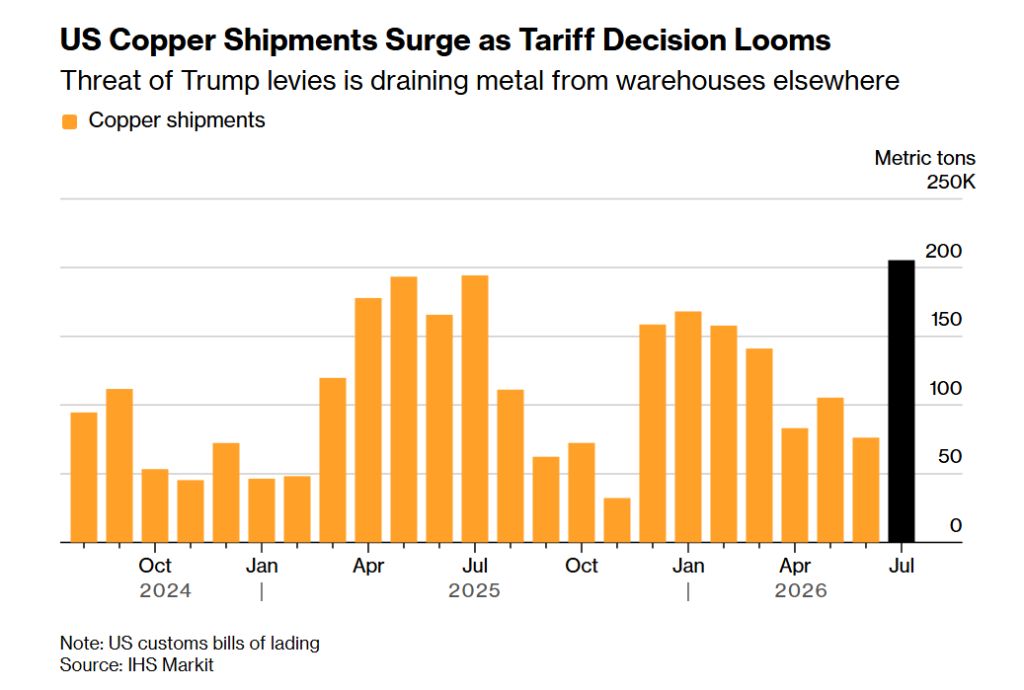
Copper Awaits Trump Tariff Decision
Bloomberg reports US Copper Inflows Surge as Market Awaits Trump Tariff Call
Copper is pouring into the US at the fastest rate in at least 12 years as traders position ahead of President Donald Trump’s decision on tariffs on refined imports.
About 200,000 metric tons arrived in July, the biggest monthly inflow on record in IHS Markit shipping data going back to 2014. About 110,860 tons are stored at US ports outside the London Metal Exchange’s warrant system.
The influx is being closely watched as the hoard has been built at the expense of supplies in the rest of the world. Inventories in LME warehouses outside the US have fallen sharply this year as traders diverted metal to American ports to capture higher prices.
The flows have accelerated even after a June 30 deadline for Commerce Secretary Howard Lutnick to recommend action on tariffs passed without an announcement. Producers, consumers and traders are awaiting clarity as the White House weighs whether to extend protection from semi-finished copper products to raw metal.
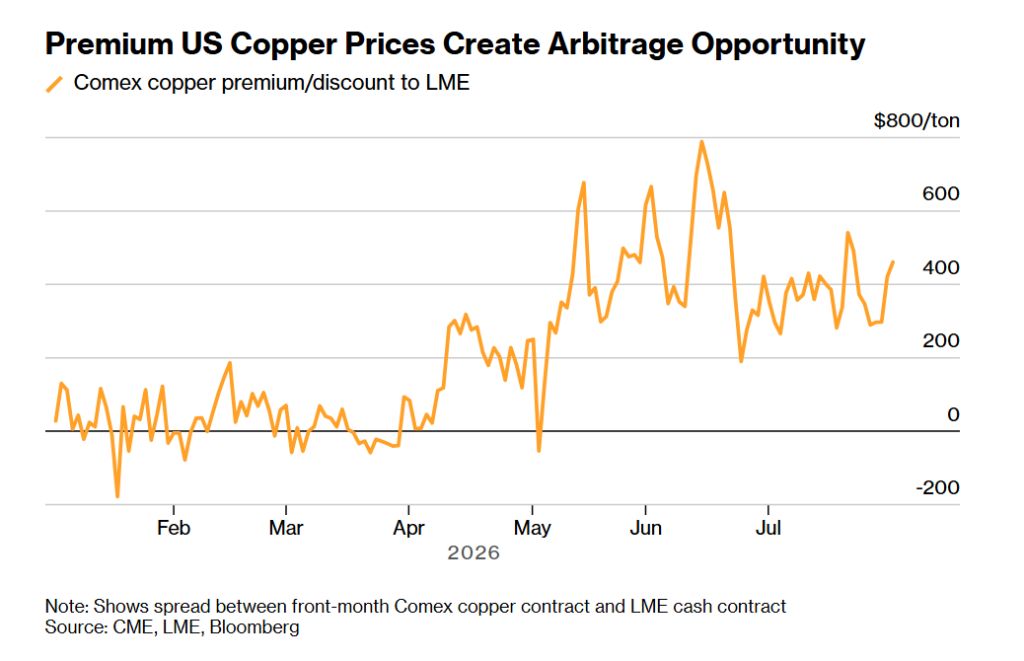
Meanwhile, Comex copper in New York continues to trade at a hefty premium to the LME, preserving an arbitrage that encourages shipments into the US.
Official Comex inventories have climbed more than 40% this year to a record, while the total US copper hoard is widely estimated at well above 1 million metric tons. The threat of tariffs is allowing the US to build stockpiles of a metal increasingly viewed as strategic for power grids, artificial intelligence, electric vehicles and defense.
Biggest Copper Stockpile on Record
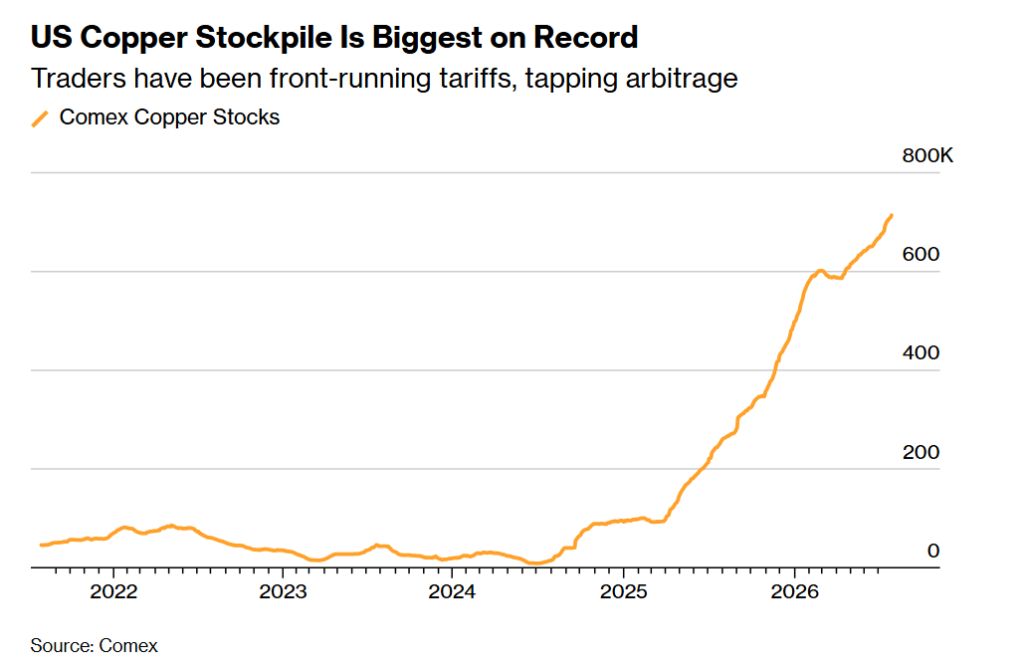
These positions have been building since March of 2025.
It’s another market that Trump has grossly distorted.
Copper Arbitrage
US Copper Production
According to the USGS Mineral Commodity Summaries 2026 (data in thousand metric tons of copper content):Mine production (recoverable):
2023: 1,130
2024: 1,050
2025 (estimated): 1,000
This is the standard measure of domestic copper output from mines. Production has declined modestly in recent years due to factors such as concentrator shutdowns and lower ore grades. Arizona accounts for the large majority (~70%). Refined copper output (primary from ore + secondary from scrap) is lower: about 921 thousand metric tons in 2024 and an estimated 850 thousand in 2025.
US Copper Consumption
Reported refined copper: 1,580 thousand metric tons in both 2023 and 2024; estimated 1,700 in 2025.
Apparent consumption (primary refined copper + copper from old/post-consumer scrap): 1,680 (2023), 1,860 (2024), and an estimated 2,200 in 2025.
Apparent consumption is the broader measure commonly used for overall U.S. demand. The U.S. is a net importer, with net import reliance rising to an estimated 57% of apparent consumption in 2025 (from ~45% in 2024), driven in part by a sharp increase in refined imports.
US Supply Grok Calculation
Metric | Amount | Years of Supply |
|---|---|---|
US Reserves | 47 million metric tons | — |
Annual mine production (2025e) | ~1.0 million metric tons | ≈ 47 years |
Apparent consumption (2025e) | ~2.2 million metric tons | ≈ 21 years |
Cost Pressures
Bloomberg has the price arbitrage difference at over $400 per metric ton.
However, net profit is typically modest to moderate after costs — often in the range of $0 to $150 per metric ton, depending on the origin of the copper and the trader’s logistics efficiency.
Thus, the windfall isn’t as big as one might think.
However, the cost pressures are very real.
Tariff Risk
What exists today: There is a 50% Section 232 tariff on semi-finished copper products (pipes, tubes, rods, sheets, wires, etc.) and many copper-intensive derivative products (cables, connectors, etc.). These were imposed in mid-2025 and reinforced/modified in 2026 proclamations. Some derivative categories face 25% instead.
What does not exist: There is no blanket 50% tariff on refined copper (cathodes and anodes — the primary form traded on LME and Comex and the main product moving in the arbitrage). Refined copper (and ores/concentrates/scrap) has so far been exempted.
Future risk: The administration has repeatedly flagged the possibility of phased tariffs on refined copper (commonly discussed as 15% starting 2027, rising to 30% in 2028). A formal decision has been deferred multiple times (including past a June 2026 review window). This ongoing uncertainty is exactly why the Comex premium persists.
Trump’s tariff threat continues to distort trade flows, inflate U.S. inventories, and keep the Comex–LME spread elevated even when physical arb margins are only modest.
The bottom line is US users of copper pay much more for copper than the rest of the world placing US manufacturers at a disadvantage.
ISM Manufacturing Rebound Continues. Price Index is 71.1 Percent
Please note ISM Manufacturing Rebound Continues. Price Index is 71.1 Percent.
Commodities in Short Supply
The numbers in parenthesis below are the number of months.
Aluminum; Copper; Electrical Components (13); Electronic Components (17); Integrated Circuits; Memory (7); Oil Based Products; Printed Circuit Boards; Rare Earth Components; Semiconductors (5); Steel; Steel — Hot Rolled (2); and Tungsten Products.
Aluminum has been up 32 straight months, copper 13, steel 7-9 depending on type. Manufacturers will pass these prices on.
Two Key ISM Respondent Comments
“No normalcy in sight in the world of metals. It makes me yearn for the coronavirus pandemic chaos, which was more manageable than whatever this is that we are in. At least business is better; however, the components of good business are not. Sharp pricing downturns in aluminum will make things more interesting, as supply levels will prevent those decreases from taking hold across the board. Getting customers to understand that is not always easy.” [Primary Metals]
“The pricing volatility and lead-time extensions in this market are arguably worse than the pandemic era. During COVID-19, we saw a surge of price hikes and inventory buy-ups, which caused constraints that eventually leveled out. We are seeing nothing but consistent upward trends for both pricing and lead times that show no signs of slowing down. Specifically, 5-percent to 25-percent price increases for printed circuit board assembly components and 15-percent to 45-percent increases for bare boards are negatively impacting customer demand outlook into next year. This isn’t sustainable.” [Electrical Equipment, Appliances & Components]
Related Posts
July 29, 2026: The Market Tells Fed Chairman Kevin Warsh “You Blew It Already”
The 30-Year Long Bond Yield Is the Highest in 19 Years.
July 30, 2026: Strategic Oil Reserves Down to a Record Low Two-Week Supply
The SPR is the lowest since 1982, but days should be the big concern.
July 31, 2026: How Much Did AI Spending Contribute to Second-Quarter 2026 GDP?
Five charts show the AI impact for every quarter starting 2025 Q1.

Comments
Log in or sign up to join the conversation.