

Probably 20% of the total influences. And of that, 70% reflects productivity and 25% is AI issuance. It's a view based absolutely on what the numbers say, but in the end it's a judgement call (as objective as doable, overlaid with a large dollop of subjectivity).

The spending piece has a small, but not an inconsequential impact
There are three basic AI components to account for, namely:
1. The spending piece,
2. The capital markets piece, and
3. The productivity piece.
The spending piece is relatively straightforward, as it's a straight accounting in GDP. My colleague James Knightley has dealt with this in detail here. Basically, AI accounts for a third of current economic growth. The link here with rates is the tendency for higher growth to be loosely associated with higher rates. However, given that the economy outside of AI is less dynamic, the AI piece is more of a filler than anything else.
The capital markets issuance piece has a more pursuasive impact
The capital markets piece is more complex. ING's Jan Frederik Slijkerman did a deep dive into this space recently; it's here. For 2026, he identifies TMT as a meaningful driver of additional corporate issuance in the US, and something similar in Europe. Jan Frederik goes on to argue that, while technology companies fund the bulk of their investments from operating cash flows, their rapidly increasing capital spending is weighing on corporate savings rates. As annual investment moves towards US$1 trillion, and a chunk of this is refinancing, the prognosis ahead is for issuance volumes to remain elevated. So what you see in 2026 should at least be repeated in 2027 and beyond.
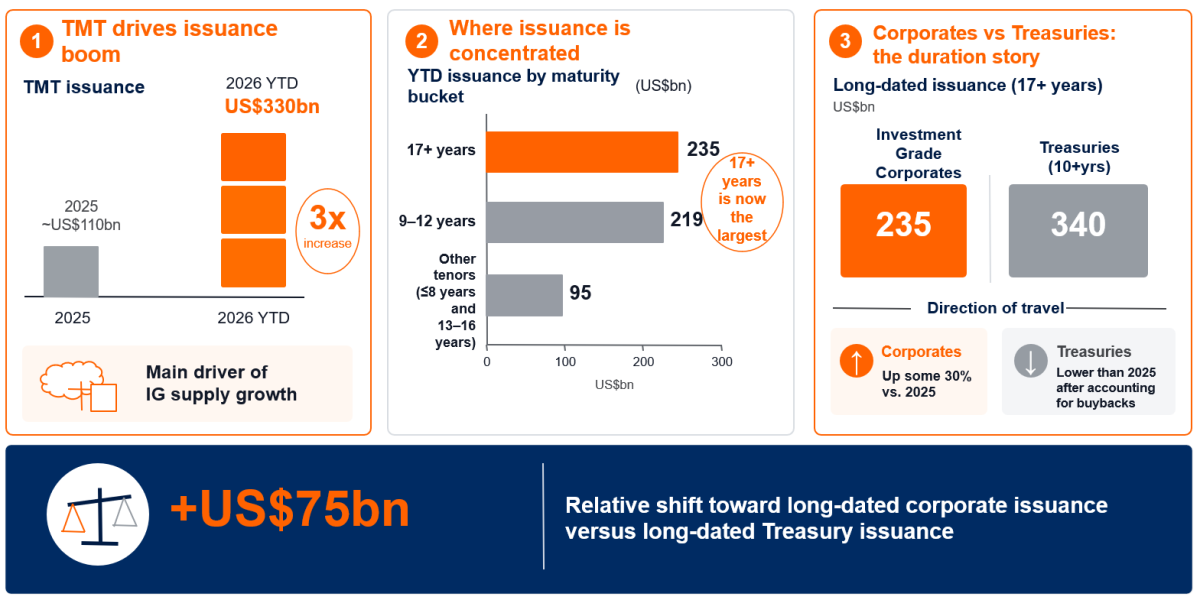
My colleagues Timothy Rahill and Marine Leleux have crunched the latest corporate supply numbers for the US and Europe. They note that year-to-date USD corporate issuance has hit US$878bn, exceeding full-year corporate issuance recorded in every year from 2021 through to 2024, and running 54% above the same period last year. The increase is driven by TMT, tripling to US$330bn. They also note that issuers have favoured the long end of the curve. Year-to-date issuance in maturities of 17 years and longer totals US$235bn, making it the largest maturity bucket, ahead of 9–12 year tenors (US$219bn).
Equivalent issuance along the 10yr to 30yr part of the US Treasury curve sums to US$340bn. That’s unchanged versus the previous year. If we factor in buybacks, they are running at some US$20bn above last year. So the swing factor from a US Treasuries perspective is an effective reduction in net issuance of the aforementioned US$20bn. Contrast that with long-dated investment-grade corporate issuance, which is running up US$55bn compared with last year.
Adding the two together, we have an overall 'delta' of some US$75bn (calculated as a US$55bn increase in corporate long-dated issuance versus a US$20bn increase in long-end Treasury buybacks for 2026). In other words, long-dated issuance pressure has been skewed towards corporates and away from US Treasuries. We’d not consider this in any way destabilising. But it’s absolutely a factor to take into account.
Long-dated corporate supply surges, led by TMT
A US$75bn swing in relative long-end corporate issuance versus Treasuries
It’s always difficult to put a basis point implication of this on long dates, but it’s tough to argue that this is not a contributing factor. Even with less corporate issuance outside the AI space for 2026, aggregate corporate issuance is still well up, and with a longer duration tilt to boot. These AI-spend players have also chosen to issue bonds in place of bank borrowing in order to get the required size and duration. The bank avenue would have meant banks' funding is much shorter (traditional bank duration mismatch). Bank lending is up, but nowhere near the same scale of the increase in bond issuance. So, either way, back ends are feeling more pressure than they would for long-dated funding.
That all being said, the market has remained quite receptive to AI and wider corporate issuance. New issue premiums have tended to be higher for longer duration / AI-related issuance, but in the 10bp area they are far from tipping the long end over the edge.
The productivity piece pushes in the same direction, but more mythical in nature
The productivity revolution that AI promises should enhance the productive capacity of both capital and labour. It's actually difficult to glean this from observed outcomes, but theoretically, productivity enhancement should correlate with upward pressure on real yields. The theoretical chain here is from higher productivity to higher expected return on capital to higher investment spending financed through higher issuance, in turn commanding higher real rates. And in terms of the productivity of labour, it's difficult to argue that productivity is not significantly enhanced for knowledge-based activities and for customer support, and especially in coding generally.
The dot.com boom, from the late 1990s into 2000, has echoes in the AI one that we see today. The 10yr real yield was at 4% back then. And that 4% real yield coincided with a 10yr Treasury yield at comfortably over 6%. Arguably, the productivity story today is even more persuasive than it was back then. The current 10yr real yield is 2.9%. And the 10yr nominal yield is at 5.2%. So we're still at least 100bp below the levels we saw back in 2000. Whether we like it or not, rises in real yields for productivity reasons should be construed as higher yields for 'positive' reasons.
A suggested breakout of influences from AI
Here's a suggested breakdown of the pure AI impact.
1. About 5% from the spending piece
2. About 25% from the issuance piece
3. About 70% from the productivity piece
But we can't leave it here, as AI is not the only influencer for long-dated rates. In fact, we'd argue that two other drivers – inflation and fiscal deficits – have been more impactful.
It's far from all about the AI impact, as holistically we have inflation and fiscal deficit factors too
It's tough to paint a picture of long rates without incorporating the classic influences of inflation and fiscal deficits.
On the US fiscal deficit issue specifically, the emphasis is on the narrative and painting a picture of debt dynamics. Back in 2024, we did a US special on this. See it here. ING's Carsten Brzeski, James Knightley and James Smith recently penned a wider update here. The fly in the ointment here is that US Treasury issuance is no higher this year than last, and the same can be said of the fiscal deficit in cash terms. Instead, the market is concerned with the lack of US congressional ambition to undertake measures to improve the path for debt dynamics. Hence, the importance of the 'narrative' does not improve for the foreseeable future.
The inflation profile is also key. The pandemic shocked developed markets back into inflation generation capability, and the Iran war and energy price spikes have juiced things up again. At the same time, where we are now for the US long yields is no more than a return to slightly above normal, by about 50bp in the 10yr. See more here on what that is all about. Ahead, we have inflation remaining sticky to the upside for 2026, before easing lower for 2027.
What's driving higher long-end yields?
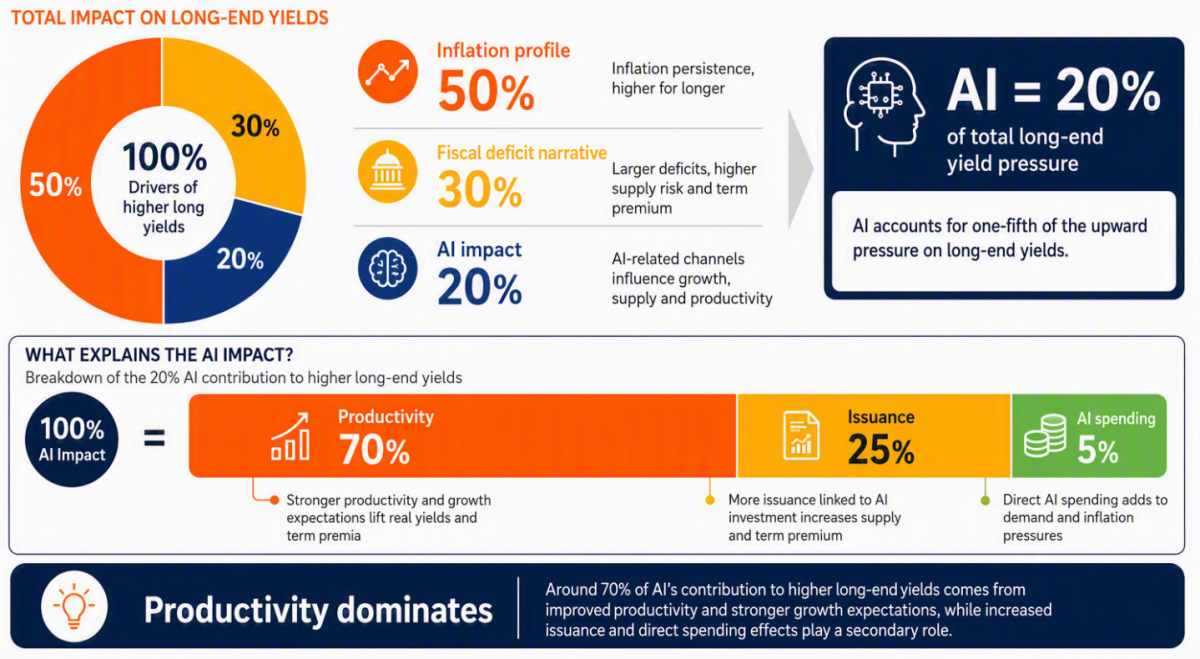
The final breakout is as follows:
1. Inflation profile = 50%
2. Fiscal deficit narrative = 30%
3. AI piece = 20%
Contain inflation, and we go a long way to containing market rates. Deficits mean supply, and that's an important ongoing influencer. And AI? Well, it's more the 'good' (productivity) than the 'bad' (issuance) that impacts. And the ugly? Well, that's inflation. Even though break-even expectations have remained contained, printed inflation has not. For the second quarter, the US GDP deflator (effectively inflation) was 4.4%, and nominal GDP rose by 6.6%. The current 10yr yield at 5.2% is not out of kilter with that. For more on the prognosis ahead, see here and here.



Comments
Log in or sign up to join the conversation.