


The headline divergence between Intuitive Surgical (ISRG) and Becton, Dickinson and Company (BDX) is not merely a function of disparate growth rates or market capitalizations; it is a structural question concerning the durability of cash generation within the medical technology sector. A fundamentals-driven review of the latest SEC filings reveals a stark contrast: ISRG commands an 80-20 superiority score, while BDX trails at 20. This disparity does not stem from a single outlier but rather from a compounding effect of margin quality, capital efficiency, and revenue velocity. The central tension is whether BDX’s larger absolute scale—evidenced by a $21.84 billion revenue base compared to ISRG’s $10.06 billion—can offset the latter’s superior operational leverage and return metrics. The evidence indicates that scale alone is insufficient when underlying capital allocation and margin expansion diverge materially.
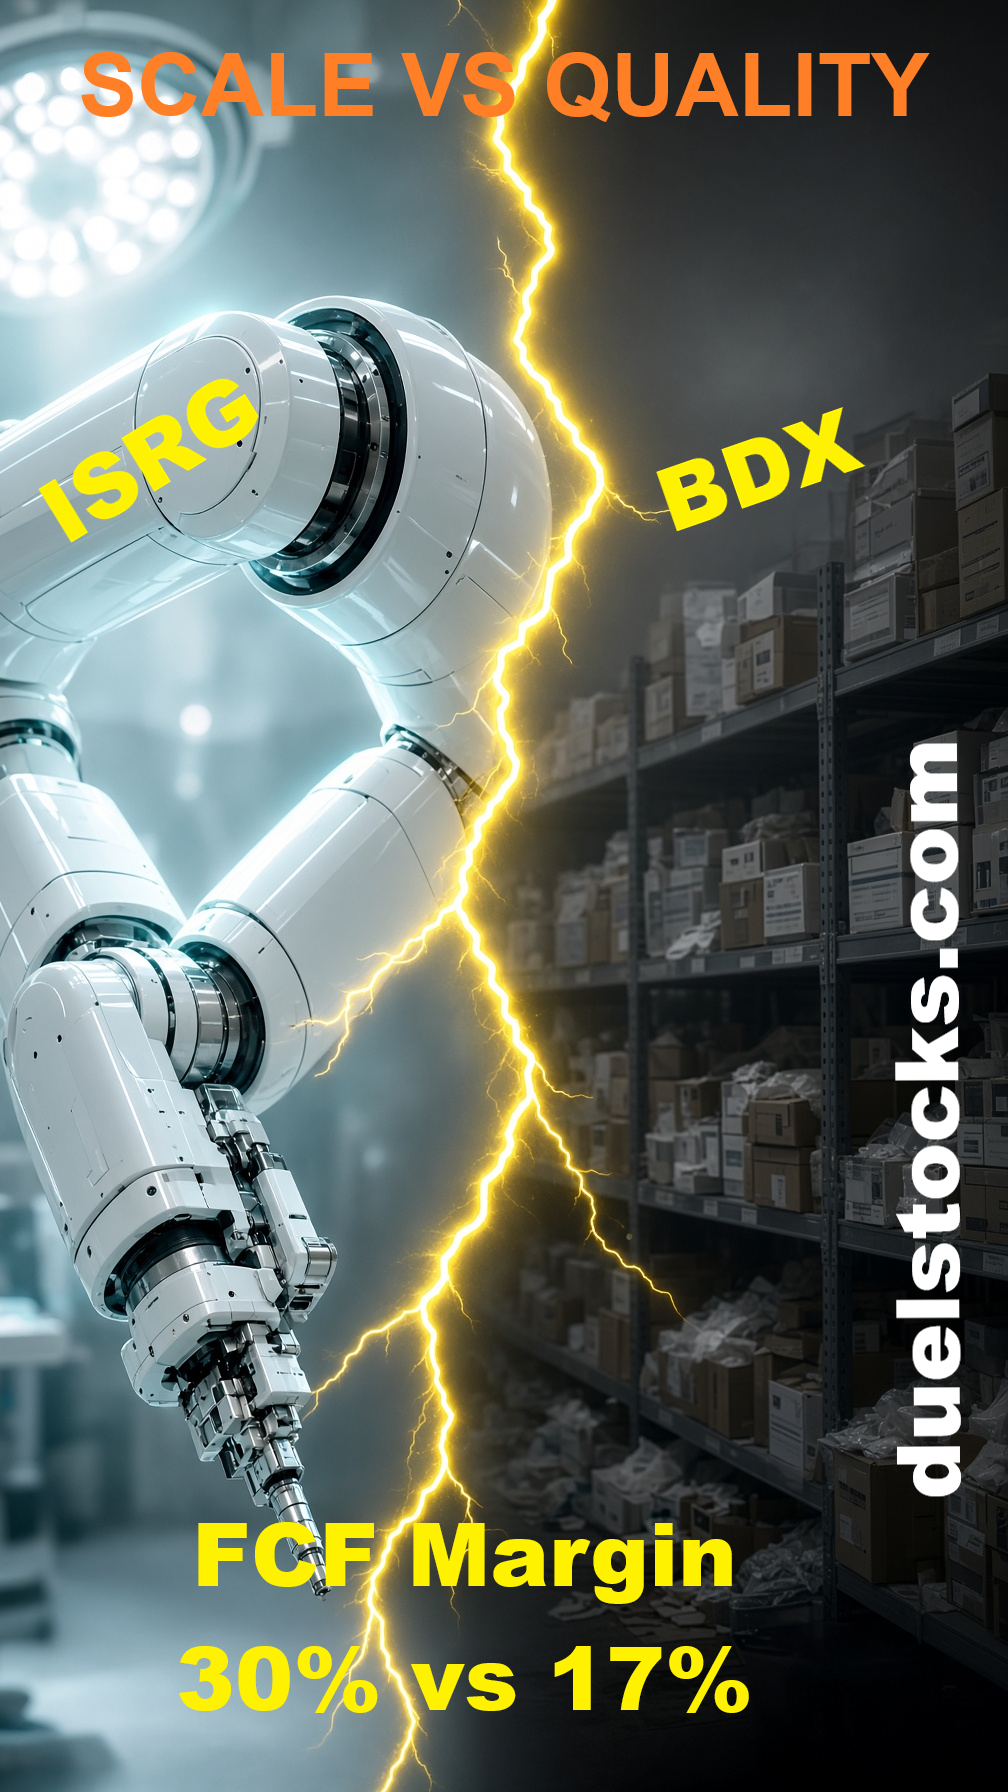
The most immediate differentiator is the trajectory of revenue growth. ISRG is expanding its top line at a 17.39% annualized rate, a figure that stands in sharp relief against BDX’s 4.99% growth. This is not a marginal difference but a structural one, implying a fundamentally distinct phase in the business lifecycle. For ISRG, this growth rate is sustained alongside a substantial expansion in cash flow, suggesting a period of high operating leverage. In contrast, BDX’s slower growth, while still positive, signals a mature, potentially stagnant, top-line environment. When paired with Free Cash Flow (FCF) margins, the implication becomes clear: ISRG is not merely selling more; it is converting those sales into cash at a markedly higher rate.
This conversion efficiency is where the argument for ISRG’s superiority becomes most robust. The company’s Operating Margin stands at 29.27%, nearly triple BDX’s 11.81%. More critically, ISRG’s FCF Margin is 29.78%, compared to BDX’s 17.80%. These figures are not cosmetic; they are the bedrock of intrinsic value. A 29.78% FCF margin indicates that for every dollar of revenue, ISRG retains nearly thirty cents in cash after all operational expenses. This level of efficiency is rare in capital-intensive industries and suggests a business model with high barriers to entry and strong pricing power. BDX’s 17.80% FCF margin, while respectable, reveals a business that is more capital-constrained or subject to higher operational drag. The divergence in operating margins (29.27% vs. 11.81%) further reinforces this, indicating that ISRG’s cost structure is inherently more favorable, likely due to the software-hardware ecosystem lock-in characteristic of surgical robotics, whereas BDX’s diversified portfolio of consumables and devices may suffer from lower-margin product lines.
The efficiency of capital deployment provides the final piece of the puzzle. ISRG’s Return on Invested Capital (ROIC) is 14.34%, significantly outpacing BDX’s 4.77%. This metric is critical because it measures how effectively management turns capital into profit. A 14.34% ROIC suggests that ISRG is generating substantial excess returns on the capital it invests, a hallmark of a high-quality franchise. In contrast, BDX’s 4.77% ROIC implies that the company is struggling to generate value above its cost of capital, or at least is doing so at a considerably slower pace. This gap is further illuminated by the Asset Turnover ratio. ISRG’s 0.48x turnover, while seemingly lower than BDX’s 0.43x, must be viewed in the context of its much higher margins. ISRG generates more profit per dollar of assets, even if it turns those assets slightly less frequently. This combination of high margins and solid ROIC creates a compounding engine that BDX’s broader but less efficient asset base cannot match.
However, a complete analysis must also consider earnings quality. The Sloan Ratio, which measures the accrual component of earnings, is negative for both companies, indicating that reported earnings are largely backed by cash flow. ISRG’s -2.15% ratio is slightly better than BDX’s -7.91%, suggesting that BDX’s earnings quality is marginally more reliant on non-cash accounting adjustments. While both ratios are within acceptable limits, the divergence hints at a slight structural weakness in BDX’s financial reporting, possibly due to the complexity of its diversified revenue streams. Additionally, the Receivables Turnover ratio shows BDX collecting cash faster (9.24x) than ISRG (6.02x), which is a point in BDX’s favor regarding working capital management. Yet, this advantage is insufficient to offset the substantial gaps in margin and return metrics. The speed of collection matters less if the underlying profitability of each sale is significantly lower.
The DCF valuation data further underscores the market’s implicit pricing of these fundamentals. The calculated Fair Value projections for ISRG show a price trajectory from $178.04 to $214.85 over three years, implying a compound annual growth rate driven by the 17.39% revenue growth and 14.34% ROIC. BDX’s projections, moving from $179.23 to $224.13, reflect its slower growth and lower returns. The WACC (Weighted Average Cost of Capital) for ISRG is 10.82%, higher than BDX’s 8.83%, which may seem counterintuitive for a company with superior metrics. However, this higher discount rate likely reflects the market’s perception of ISRG’s growth sustainability or sector-specific risks. Despite the higher discount rate, ISRG’s superior cash flow generation and growth prospects result in a higher projected fair value trajectory. The terminal growth rates of 3.00% for ISRG and 2.50% for BDX also reflect the market’s expectation of ISRG’s ability to sustain growth beyond the explicit forecast period.
The Resilience Report confirms that both companies maintain healthy balance sheets and consistent cash flow-to-growth relationships. The "OK" status for Growth vs. FCF, ROIC vs. Sloan, and Debt vs. Cash for both entities indicates that neither company is engaging in risky financial engineering to prop up its numbers. This consistency is a baseline requirement, not a differentiator. The real distinction lies in the operational metrics: ISRG’s ability to scale revenue while expanding margins and returns, whereas BDX is growing slowly with constrained returns.
In conclusion, the data from the SEC filings paints a clear picture: ISRG is the superior fundamental investment based on the provided metrics. The 80-20 score is justified by its dominant position in revenue growth (17.39% vs. 4.99%), operating efficiency (29.27% vs. 11.81% operating margin), and capital returns (14.34% vs. 4.77% ROIC). BDX’s larger revenue base ($21.84 B vs. $10.06 B) and faster receivables turnover (9.24x vs. 6.02x) are outweighed by its inability to generate comparable cash flow margins or returns on capital. The shared limitation in this comparison is that both companies are evaluated on trailing data, and future performance will depend on macroeconomic conditions and sector-specific disruptions. However, based on the current financial structure, ISRG’s model demonstrates a more durable and scalable path to value creation, while BDX’s model appears constrained by lower margins and capital efficiency. The evidence does not support the notion that scale can compensate for a lack of quality in earnings and returns.



Comments
Log in or sign up to join the conversation.