

The headline score of a 45-55 split between META and AAPL creates an immediate analytical tension. On the surface, the result appears to be a near-stalemate between two technology giants. Yet the underlying SEC data reveal a fundamental divergence in how each company creates value. Apple dominates in capital efficiency and scale, while Meta leads in growth velocity and operating leverage. The central question is not which company is inherently “better,” but which business model proves more resilient and valuable in the current environment. The EDGAR filings supply the raw material for that assessment; the interpretation requires looking beyond surface-level metrics.
Revenue growth is the most striking differentiator. Meta’s year-over-year growth of 19.89% stands in sharp contrast to Apple’s 1.81%. The disparity is not solely a function of scale. Apple’s revenue base of $416.16 billion makes rapid expansion mathematically difficult, whereas Meta’s $200.97 billion base still permits more aggressive growth. The three-year CAGR figures—19.89% for Meta versus 1.81% for Apple—reinforce the same pattern. Meta remains in a growth phase; Apple operates in a maintenance phase. Growth alone, however, does not determine value. The quality of that growth, measured by margins and returns, is equally critical.
Operating margins tell a different story. Meta’s 41.44% operating margin significantly exceeds Apple’s 31.97%, pointing to stronger cost discipline and pricing power relative to revenue. Operating cash margins widen the gap further: Meta’s 57.62% far surpasses Apple’s 26.79%. This indicates that Meta converts a substantially larger share of its operating income into cash—the true lifeblood of any business. Meta’s ability to generate cash at a rate higher than its operating margin signals efficient working-capital management and robust pricing power. Apple’s lower cash margin relative to its operating margin may reflect higher working-capital requirements or other operational frictions.
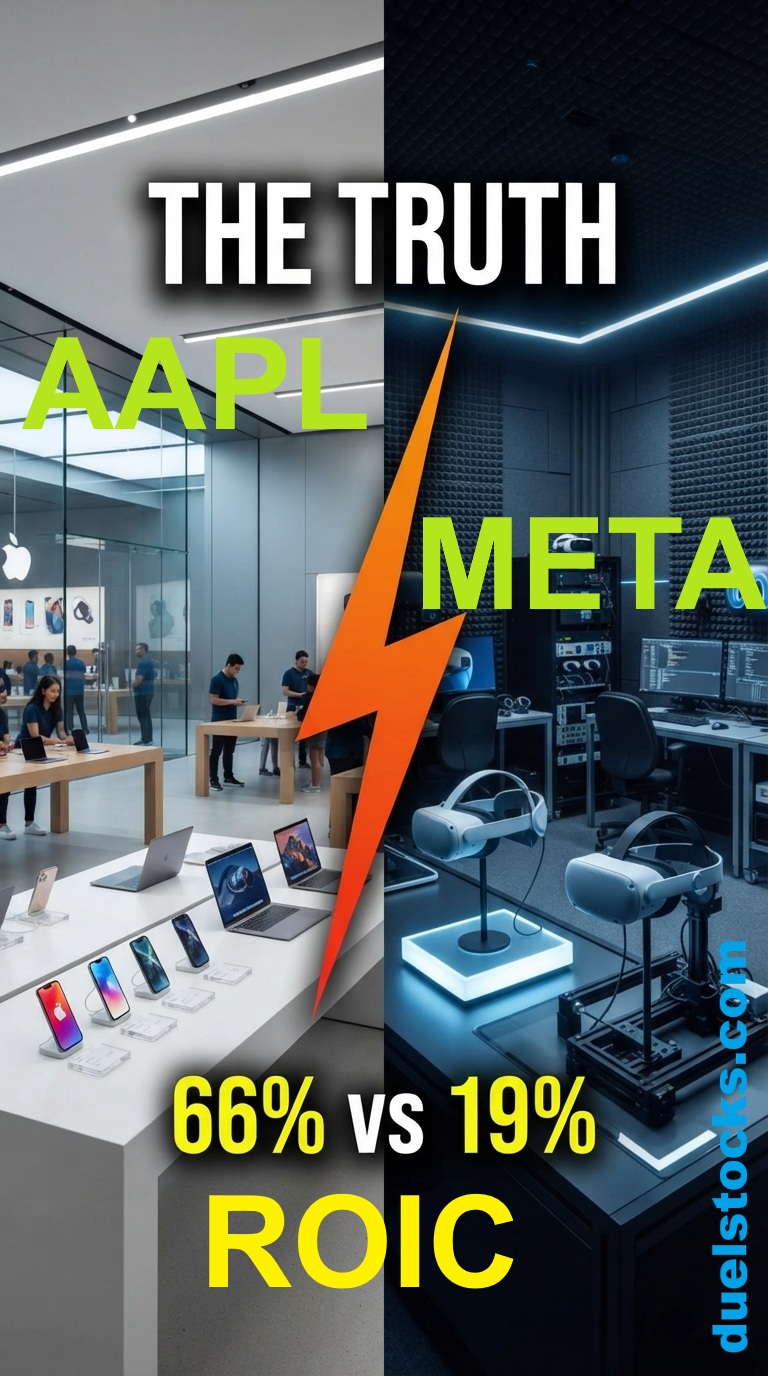
Return on invested capital (ROIC) presents the clearest efficiency contrast. Apple’s ROIC of 66.40% is exceptionally high and far exceeds Meta’s 18.96%. The figure underscores Apple’s superior ability to generate returns from its invested capital. At the same time, such elevated returns are consistent with a mature business model in which reinvestment opportunities are more limited. Meta’s lower ROIC, paired with its rapid growth, suggests the company still possesses substantial reinvestment opportunities. The open question is whether Meta can sustain its growth trajectory while gradually improving ROIC. Free-cash-flow margins are nearly identical—Meta at 22.94% and Apple at 23.73%—rendering the difference negligible. The decisive distinction lies in the growth path each company is following.
Asset turnover supplies additional context. Apple’s asset turnover of 1.09x is more than double Meta’s 0.45x, confirming that Apple generates substantially more revenue per dollar of assets. This aligns with its high ROIC and efficient asset utilization. Meta’s lower turnover is consistent with heavy investment in long-term growth initiatives, particularly AI and infrastructure. The data indicate that Meta is deliberately accepting lower current efficiency in exchange for future expansion—a classic trade-off for high-growth enterprises.
The Sloan Ratio, a measure of earnings quality, is virtually identical. Apple’s 2.29% and Meta’s 2.26% both fall comfortably within acceptable ranges, indicating that neither company is relying on aggressive accruals to inflate reported earnings. This consistency check supports the reliability of the reported figures: both firms are generating earnings backed by cash flow—an important signal for long-term investors.
Discounted-cash-flow valuation offers a forward-looking lens. Apple’s fair-value projection rises from $111.47 to $132.64 over three years, implying modest annual growth. Meta’s fair value moves from $523.86 to $607.42 over the same horizon, reflecting a more robust trajectory. Apple’s weighted average cost of capital stands at 7.08%, while Meta’s is 8.63%, capturing the higher risk associated with Meta’s growth strategy. Terminal growth rates further underscore the divergence: 0.91% for Apple versus 3.00% for Meta.
The resilience assessment introduces an additional dimension. Apple’s FRI score of 61 carries a –5 penalty for elevated leverage. A debt-to-equity ratio of 0.8 and a cash-to-debt ratio of 0.5 show that Apple employs debt to fund operations—a common practice among mature companies, yet one that introduces measurable financial risk. Meta’s resilience is not scored in identical terms, but its strong cash generation and growth trajectory point to a more flexible balance-sheet profile.
Receivables turnover provides a final operational detail. Apple’s 13.25x exceeds Meta’s 9.24x, indicating faster collection and stronger bargaining power with customers. While useful, this metric is secondary to the broader cash-flow and growth dynamics already examined.
In sum, the SEC filings portray two distinct business models. Apple is a mature, highly efficient franchise that delivers exceptional returns on capital but limited growth. Meta is a high-growth platform that generates robust cash flow and retains significant reinvestment capacity. The choice between them hinges on an investor’s risk tolerance and growth expectations. Those prioritizing stability and superior capital returns will favor Apple. Those willing to accept higher risk in pursuit of faster expansion will prefer Meta. The data do not crown a definitive winner; they illuminate the inherent trade-offs embedded in each model.



Comments
Log in or sign up to join the conversation.