

The headline score of 74-26 in favor of Union Pacific (UNP) over Wabtec (WAB) suggests a decisive victory for the railroad operator, but the underlying data reveals a more nuanced tension between scale and momentum — one that the full interactive breakdown at https://duelstocks.com/duel/unp-vs-wab lays out metric by metric. While UNP’s sheer size and margin profile create an aura of invincibility, WAB’s growth trajectory offers a compelling counter-narrative that challenges the assumption that higher quality always equates to superior current performance. This comparison is not merely a contest of who is bigger, but a study in how different capital structures and growth phases interact to define value in the industrial sector.
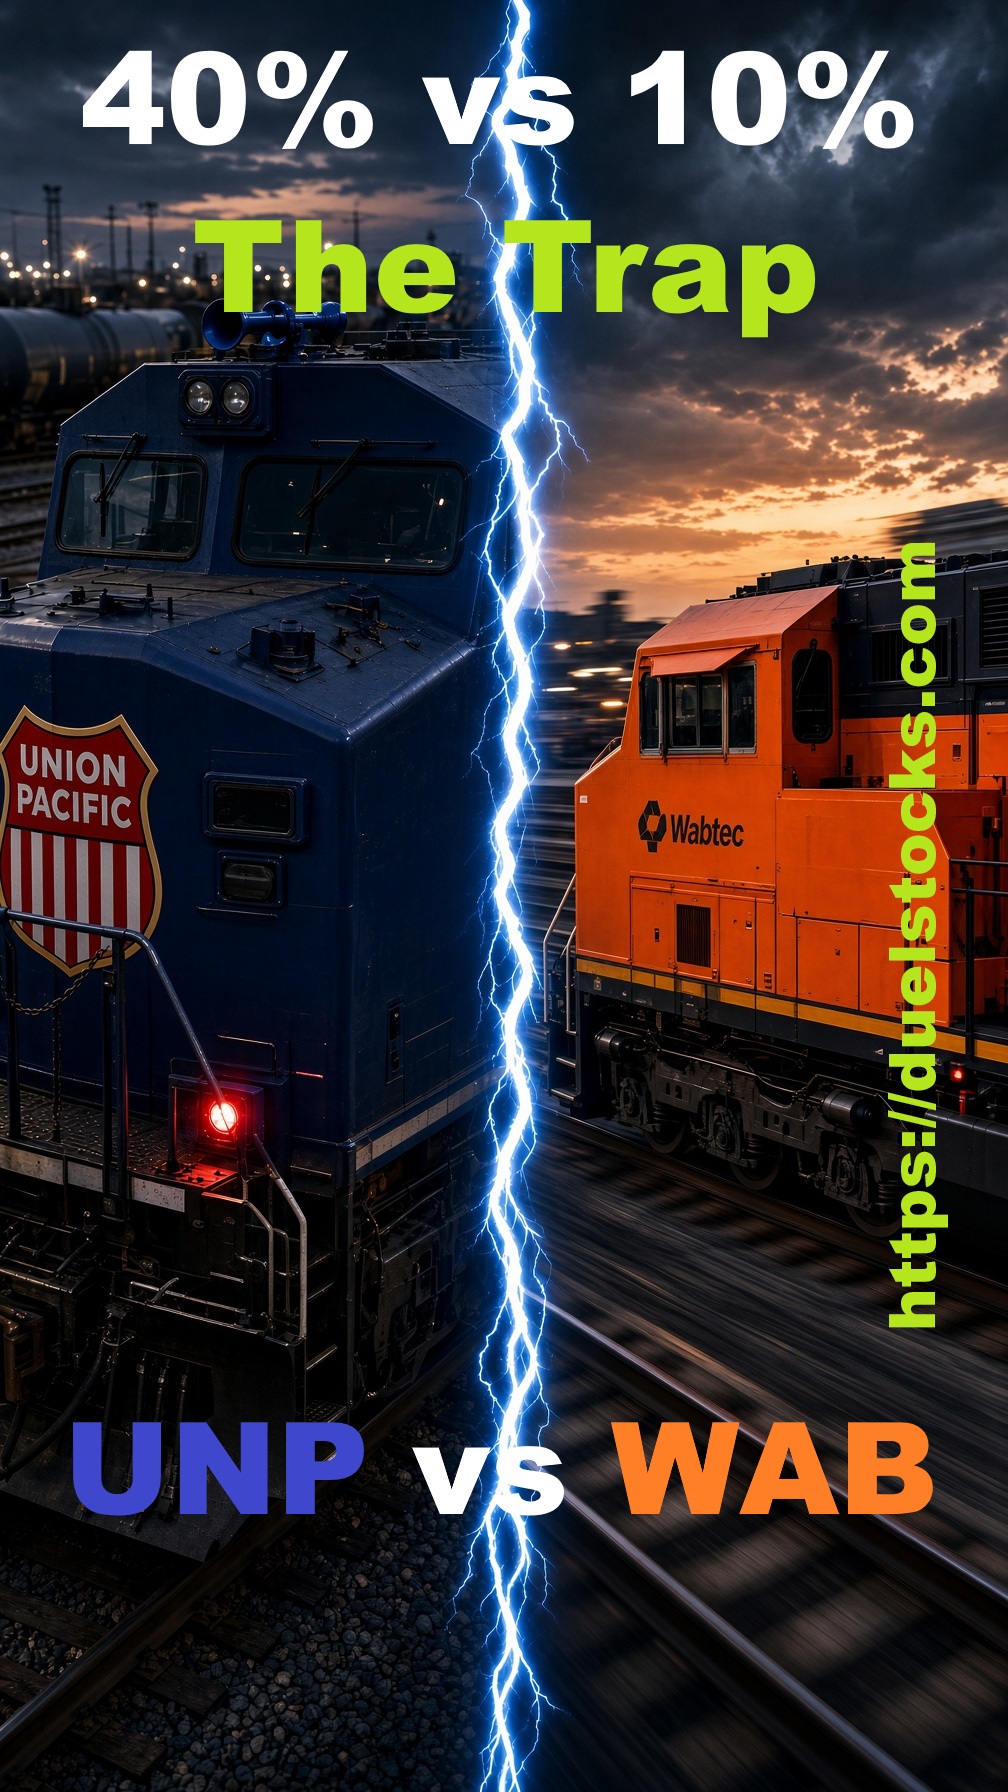
At the heart of this divergence is the stark contrast in revenue growth. WAB’s year-over-year revenue growth of 10.12% stands in sharp relief to UNP’s slight contraction of -0.49%. This is not just a statistical difference; it reflects the broader economic reality of the industries these companies serve. Wabtec, as a provider of critical rail equipment and services, is benefiting from a cycle of infrastructure investment and maintenance, driving its top line higher. Union Pacific, despite its massive $24.51 billion in revenue, is facing headwinds that are constraining its growth. This stagnation in revenue growth for UNP is a critical data point that undercuts its dominance in other areas, suggesting that its market position, while strong, is not immune to cyclical pressures.
However, the story does not end with growth. When we look at profitability, UNP’s superiority is undeniable and deeply entrenched in its business model. Union Pacific’s operating margin of 40.17% is a testament to its efficiency and pricing power, nearly double Wabtec’s 16.06%. This margin differential is not accidental; it is a result of UNP’s asset-heavy, high-barrier-to-entry business, where it can leverage its network effects to maintain high profitability. Wabtec, while profitable, operates in a more competitive space where margins are naturally compressed by the need for continuous innovation and customer acquisition. The 40.17% operating margin for UNP is a powerful indicator of its quality, but it also highlights the structural limitations of its growth potential.
The efficiency of capital deployment further reinforces this narrative. Union Pacific’s Return on Invested Capital (ROIC) of 15.35% significantly outpaces Wabtec’s 7.79%. This metric is crucial because it shows how effectively each company is using its capital to generate profits. UNP’s ability to generate a 15.35% return on its invested capital indicates a highly efficient operation, while Wabtec’s 7.79% ROIC suggests that it is still in a phase of heavy investment, likely to support its growth. This divergence in ROIC is a key factor in the DCF valuation, where UNP’s higher ROIC contributes to a more robust fair value projection.
The free cash flow (FCF) margin is another critical area where UNP excels. With an FCF margin of 22.44%, UNP is generating significantly more cash relative to its revenue compared to Wabtec’s 13.42%. This cash generation capability is a direct result of UNP’s high operating margins and its ability to manage working capital effectively. Wabtec’s lower FCF margin, while still positive, reflects the higher capital requirements associated with its growth strategy. The $5.50 billion in FCF base for UNP, compared to Wabtec’s $1.50 billion, underscores the scale advantage of the railroad operator, but it also raises questions about the sustainability of this cash flow in the face of potential regulatory or economic challenges.
The balance sheet health of both companies presents a mixed picture. Union Pacific’s debt-to-equity ratio of 1.4 is a significant concern, especially given that its cash covers only 0.1x of its debt. This high leverage, combined with the negative revenue growth, creates a risk of a debt trap, where the company’s ability to service its debt is compromised by its operational performance. Wabtec, on the other hand, maintains a healthier balance sheet with no such risk flags, allowing it to continue its growth trajectory without the same level of financial pressure. This disparity in financial health is a critical factor in the resilience report, where UNP is flagged for its debt risk, while Wabtec is deemed stable.
The asset turnover and receivables turnover ratios provide additional context to this analysis. Wabtec’s asset turnover of 0.48x is higher than UNP’s 0.34x, indicating that Wabtec is more efficient in using its assets to generate sales. This is consistent with its growth strategy, which likely involves a more agile and less capital-intensive business model. Conversely, UNP’s receivables turnover of 11.51x is significantly higher than Wabtec’s 6.49x, suggesting that UNP is more efficient in collecting its receivables. This efficiency in working capital management is a key contributor to UNP’s strong FCF margin, but it also highlights the different operational dynamics of the two companies.
The DCF valuation model, while providing a forward-looking perspective, is heavily influenced by these underlying fundamentals. UNP’s higher ROIC and FCF margin contribute to a fair value projection that suggests a price of $92.77 currently, with a projected increase to $120.23 over three years. Wabtec, despite its lower margins and ROIC, is projected to reach $202.48 in three years, driven by its higher revenue growth and terminal growth rate of 3.00% compared to UNP’s 0.50%. This divergence in valuation expectations highlights the market’s willingness to pay a premium for growth, even at the expense of current profitability.
The resilience report further complicates the picture. Wabtec’s FRI score of 55, with no penalties, indicates a stable and resilient business, while UNP’s debt risk flag suggests potential vulnerabilities. This resilience is a critical factor in the long-term sustainability of both companies, as it determines their ability to weather economic downturns and regulatory changes. Wabtec’s ability to maintain its growth trajectory without significant financial risk is a compelling argument for its long-term value, while UNP’s debt risk raises questions about the sustainability of its current performance.
In conclusion, the 74-26 score in favor of Union Pacific is a reflection of its superior profitability and cash generation, but it does not tell the whole story. Wabtec’s growth momentum and financial resilience offer a compelling alternative, challenging the assumption that higher quality always equates to superior current performance. The data suggests that while UNP is the more profitable and efficient company, Wabtec is the more dynamic and resilient one, with a higher potential for long-term growth. This comparison highlights the importance of looking beyond headline scores and understanding the underlying dynamics that drive value in the industrial sector. The true winner is not defined by a single metric, but by the interplay of growth, profitability, and risk, and it is up to the investor to determine which factors are most critical to their strategy. For those who want to apply the same structured methodology to other industrial matchups, the full library of interactive duels is available at https://duelstocks.com, where every comparison follows the identical data-driven framework.


Comments
Log in or sign up to join the conversation.