


"It ain't what you don't know that gets you into trouble. It's what you know for sure that just ain't so." - Mark Twain
What happens if Elon Musk is right, and robots eventually build the robots that build almost everything else?
Imagine the implications. AI and robotics could dramatically increase the supply of goods while driving production costs lower, unleashing powerful deflationary pressure. That raises questions about how policymakers might respond, whether monetary expansion could offset the deflation, and what it would all mean for investors.
I've been exchanging emails with a reader about these possibilities. Our back-and-forth sent me down a rabbit hole that eventually led me to the work of Charles Gave. Charles co-founded Gavekal with his son Louis and Anatole Kaletsky. He has spent a lifetime striving to answer the question all investors have - what should I own?
His approach starts with understanding the economic environment. And that's particularly challenging today, with an economy that's still growing, mixed inflation signals, enormous debt, and technology that could someday drive production costs much lower.
His book, The General Theory of Portfolio Construction, is a great place to start.
Four Quadrants
Charles developed a framework to help investors understand which assets tend to perform best under different economic conditions. He calls it the Four Quadrants.
It's based on two variables: economic growth and inflation.
The horizontal axis tracks whether economic activity is accelerating or slowing. The vertical axis tracks whether prices are rising faster or slower.
Put the two together, and you get four possible economic environments.
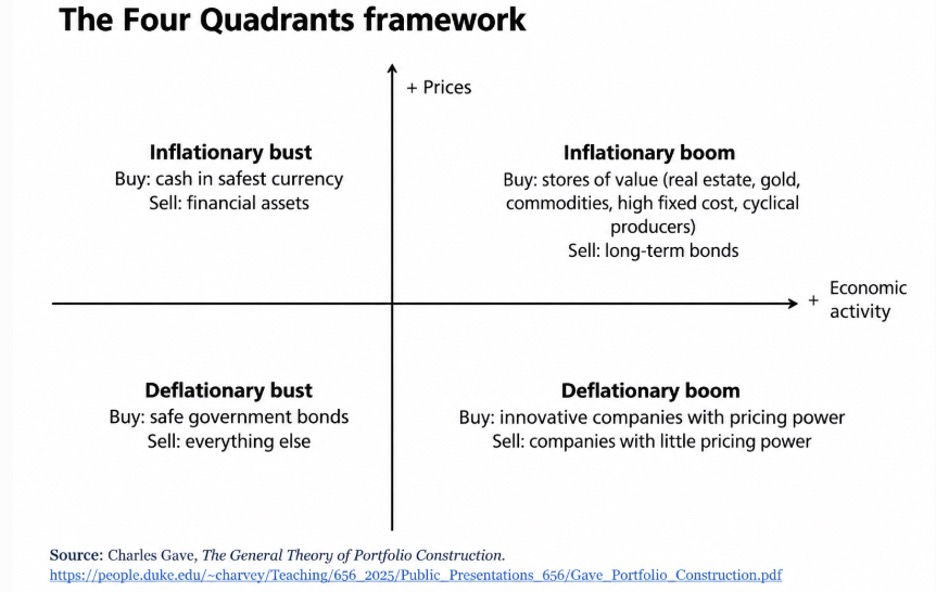
In an inflationary boom, Gave favors stores of value such as gold, real estate and commodities, along with cyclical producers. Long-term bonds are the thing to avoid.
In a deflationary boom, innovative companies with pricing power tend to thrive. An inflationary bust gives you the worst combination: economic weakness and intensifying inflation pressure. Think stagflation. Cash in a strong currency becomes valuable and financial assets can suffer. Then there is the deflationary bust. Economic activity contracts and inflation slows, potentially turning into outright deflation. Safe government bonds become the place to hide.
Simple enough.
But Charles didn't stop there. He's spent decades trying to solve the harder problem: figuring out which quadrant we're actually in, and where we're heading.
One way Charles describes the challenge is through an “impressionist painting.” You can see the overall picture, even if the finer details aren't always clear.
To illustrate how this works, let's look at a few historical examples. These are my applications of Charles's framework, not classifications he's made himself.
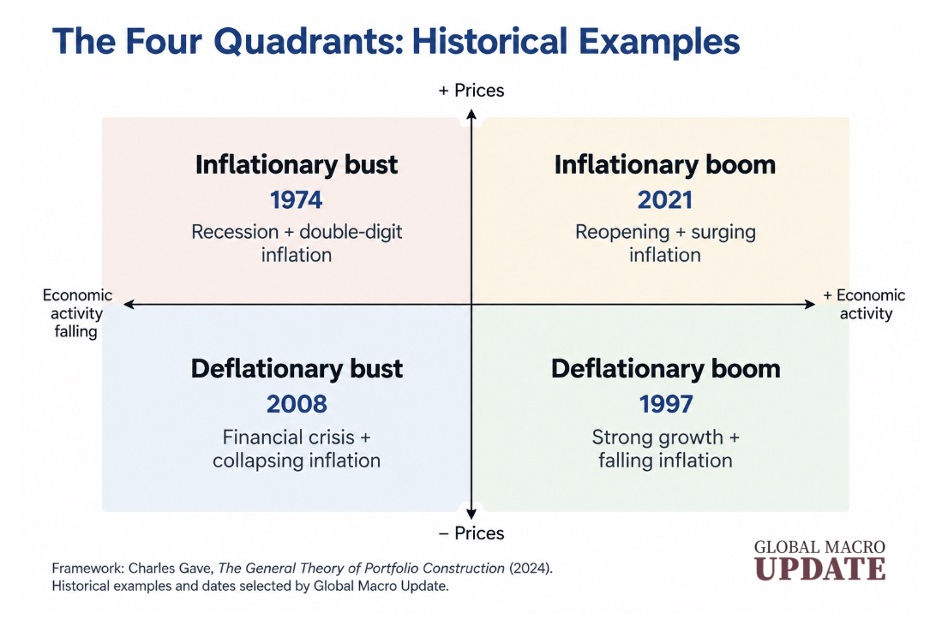
In 2021 we saw an inflationary boom. The economy expanded while inflation accelerated to 7% by December. Real estate gained roughly 19%, while 10-year Treasuries lost about 4%. Gold fell, though.
In 1997, we had a deflationary boom. Growth was strong, inflation slowed, and the S&P 500 gained roughly 33%. Gold lost 21%. Then there's 1974, an inflationary bust. The economy was in recession, inflation reached double digits, and stocks lost roughly 26%. Treasury bills returned about 8%, while gold went up. And in late 2008, we experienced a deflationary bust. Growth and inflation collapsed. For the full year, 10-year Treasuries returned roughly 20%, while stocks lost roughly 37%.
Of course, those historical examples come with an advantage we don’t have today: hindsight. We know what happened next.
Which brings us to today.
Where Are We?
A few weeks ago, I did a podcast with Lakshman Achuthan, the co-founder of the Economic Cycle Research Institute. Lakshman spent his career studying business and inflation cycles.
“I think we're still hanging out in this inflationary boom,” he told me. “I don't think everybody understands that.”
In a separate September interview, he explained that his forward-looking indicators showed both growth and inflation cycles heading higher.[1]
The economy is still growing. Real GDP expanded at a 2.5% annual rate in the first quarter and 2.2% in the second.[2]
But inflation is less clear. Annual CPI inflation fell from 4.2% in May to 3.4% in August, although monthly inflation picked up from 0.1% in July to 0.4% in August.[3] And as my friend Peter Boockvar pointed out to me just this morning, inflation for businesses (as measured by the Producer Price Index) is much higher than the CPI. Businesses are finding it hard to pass on cost increases.
I lean toward Lakshman's diagnosis. But are we firmly in an inflationary boom, or are we moving toward something else? Economic regimes don't necessarily change overnight, any more than seasons do. Here in New England an October afternoon can feel like summer, with temperatures in the 80s, followed by frost three mornings later.
This Time It's Different?
Sir John Templeton warned that the four most dangerous words in investing are “this time it's different.” I'm not about to argue he was wrong. But the difference between the historical periods we discussed and today is the sheer amount of debt.
And we have a lot of debt. An extraordinary amount, in fact.
In 1974, federal debt held by the public was roughly 23% of GDP. Today, it's around 100%. The Treasury expected to borrow $739 billion in the third quarter and another $628 billion in the fourth.[4] Alphabet (GOOGL), Amazon (AMZN), Meta (META), Microsoft (MSFT) and Oracle (ORCL) have issued roughly $220 billion of debt this year, more than twice last year's total, much of it tied to the AI buildout.[5] Meanwhile, the 10-year Treasury yield reached 5.34% on October 1, its highest level since 2002.[6]
Of course, borrowing isn't the only reason yields are rising. Inflation concerns, oil prices, expectations for Fed policy, and a growing economy matter, too. But I keep coming back to the amount of money governments and businesses need to borrow. What happens if inflation starts falling, but all that demand for capital keeps borrowing costs elevated?
Could we be moving toward a disinflationary boom without seeing the bond-market behavior we'd ordinarily expect? That would make figuring out where we're headed, and what to own along the way, a lot more interesting.
Robots Making Robots
Back to our original questions. Imagine Elon is right.
AI gets dramatically better. Robots begin building robots. Those robots manufacture more of the things we consume. Productivity rises. Production costs fall.
On Charles's chart, you can imagine where that eventually leads: strong economic growth with less inflation pressure. A disinflationary boom.
But look at what we're doing to get there. We're building data centers. Power plants. Transmission lines. Semiconductor fabs. Factories. Cooling systems. Eventually, armies of robots. And somebody has to pay for all of it.
We're building what is promised to be a disinflationary future through an extraordinarily capital-intensive present.
But that isn't the only possible outcome.
We could remain in an inflationary boom, deteriorate into an inflationary bust, or eventually experience a deflationary bust.
The same forces we're observing today could contribute to very different outcomes.
Charles gave us the map. The hard part is knowing where we are on it and where we're heading. Even if we're standing near the border between quadrants, that doesn't tell us which direction we'll go next.
That uncertainty matters when deciding what to own. Do you position for the environment you see today, the one you expect next, or some combination of the two?
For many individual investors, a better approach may be to build an all-weather portfolio. Charles Gave gives a nod to Harry Browne’s Permanent Portfolio. That a 25% allocation to gold, stocks, bonds, and cash, with periodic rebalancing. An updated version of this is what Jared calls The Awesome Portfolio, which produces slightly better returns on a back-tested basis. These mostly static portfolios are meant to take the emotion out of investing, and to make the current position on the quadrant less relevant. Of course, if you can accurately, and in real time, know where you are at, you can do better. My contention is most of us think we can do better, but only a handful truly can. Please don’t take offense!
In other news, I’ll be at Jared Dillian’s “DirtCon” annual conference next week. I always look forward to spending time in Nashville and meeting with JD and his exceptional readers. I hope to see you there. I’ll report back on what I hear.
After that, I’m off to China for two weeks, touring tech and investment companies. This is my first trip to China. It’s long past time I see for myself what is happening on the ground. I’m told there will be robots. Again, I’ll report on what I see.
In the meantime, where would you put the US economy on Charles's chart today? More importantly, what doesn't fit?


Comments
Log in or sign up to join the conversation.