


🏛️ Market Brief – A Bond Scare
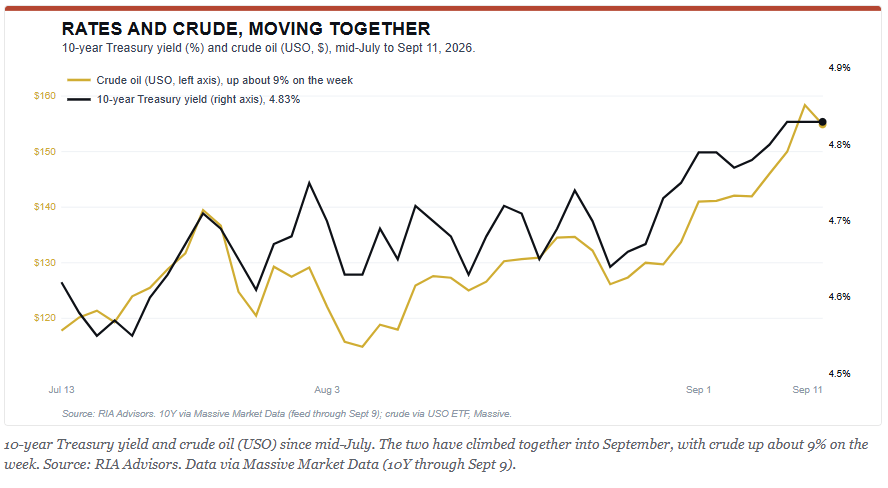
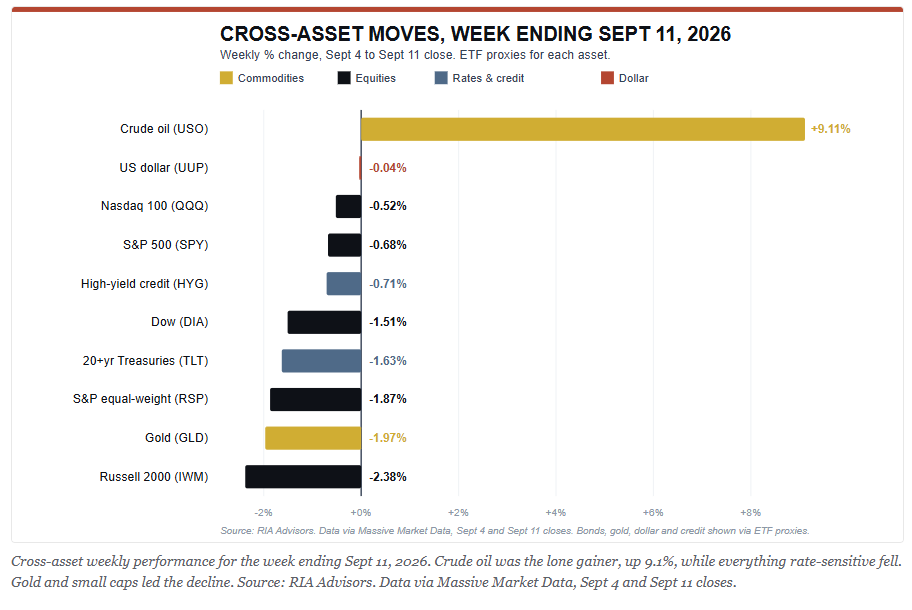
September, so far, is living up to its reputation. The market slipped to the 50-day moving average, with the tape taking orders from crude oil. For the week, crude rose about 9% over four sessions, which pulled the 10-year Treasury yield higher right along with it, closing just under 5%. The corners of the market that hate higher rates slid while the S&P 500 (SPY) dipped 0.68% to close the week at 7,666. However, that rather lackluster headline conveniently hides the real story beneath it.
Take a look at the spread between markets. Small caps (IWM) fell 2.38% while the Dow (DIA) dropped 1.51%. The equal-weight S&P index (RSP) gave up 1.87% while the cap-weighted index, by contrast, lost less than a point. The Nasdaq-100 (QQQ) barely budged, declining just 0.52%. When the average stock falls three times as hard as the index, leadership is narrowing, not broadening. As we have flagged in recent notes on the AI complex, a market carried by a handful of names runs with a thin margin for error.
Of course, the big news this week was the inflation data, which gave the bond market the excuse it needed. Headline CPI ran at 3.4% over the past year, and remains sticky, while core CPI remained at 2.4%, just above the Fed’s target.
On the producer price side, inflation told a louder story, with PPI jumping 0.4% on the month and the annual rate accelerating to 5.4% from 4.8%. However, that number, while higher than expected, will be revised lower with the benchmark revisions at the end of the month.
Overall, it was goods pricing that did the damage, which rose 1.1%, with diesel alone leaping 24%. Even core producer prices printed at 4.6%. However, while the bond market was jolted, the reality is that this was an oil shock rather than a sign of an overheating economy. The former doesn’t justify a Fed rate hike; the latter would. Neither report was a disaster, but neither one gives the Fed a clean reason to hike rates.
On a cross-asset review, the moves fit a “rate scare.” Gold fell, the dollar remained flat, and volatility lifted off its lows without anything close to panic. However, the real story remained below the surface in the cyclical and rate-sensitive groups, which dragged lower all week.
The Fed meets Tuesday and Wednesday next week, with the market still leaning toward a quarter-point hike. Firm headline inflation and a crude oil spike are not the backdrop a central bank is likely to hike into, particularly with a softening labor market.
Watch the long end into the decision. If oil keeps running and the 10-year pushes above 5%, the multiple on this market gets much harder to defend. The narrow leadership that propped everything up all summer would be the first thing to give way, which wouldn’t be a surprising outcome for the month of September heading into the midterm election cycle.
📈Technical Backdrop – Momentum Rolls Over, What Next?
I will tell you one thing: you have to give the bulls their credit. This past week was the perfect setup for a sharp sell-off in the market. Corporate buybacks are sidelined, interest rates spiked, and oil surged, pushing inflation higher. If there was ever a case for a pullback, it was this past week. Nonetheless, the correction that we have discussed over the last two weeks stopped right where the first line of support sits. The S&P 500 closed the week at 7,666, down 0.68%. The part that matters happened on Thursday, with the index trading down to 7,595 and closing dead on its 50-day moving average near 7,600. That was our initial downside target, and the market met it up to that point before Friday’s bounce lifted the price back above the line.
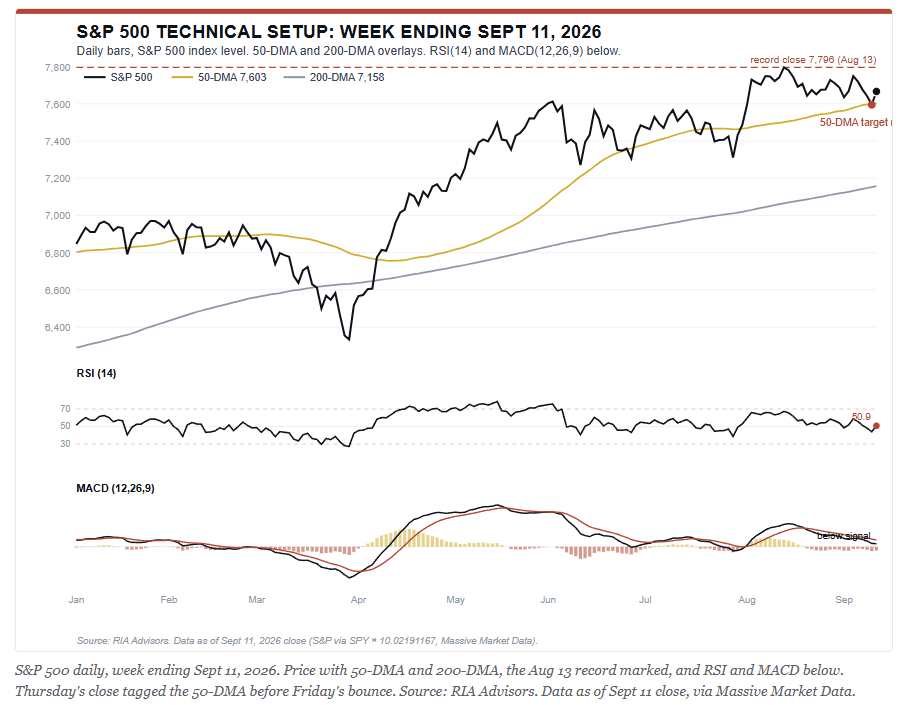
While the 50-DMA held on the first test, overall momentum remains another matter. RSI sits at 50.9, dead neutral, down from the high-50s a week ago. The MACD signal has crossed below its signal line, keeping downward pressure in place into the end of the quarter. Furthermore, the histogram has turned negative, adding to our caution. While the market held support, it did so with weakening momentum, which is the definition of an undecided tape.
From our vantage point, the breadth story is the bigger worry. The equal-weight S&P fell almost three times as hard as the cap-weighted index this past week. Most notably, it was small caps that led the whole thing lower, with volume telling the same story. Of course, the spike in crude oil didn’t help and forced the heaviest selling in the rate-sensitive names, rather than the index leaders. As noted, breadth is the key to a sustainable bull market rally. The current breadth is a warning, but not yet a sell signal.
This coming week keeps our focus on risk management. From that standpoint, we continue to recommend trimming the most extended winners back toward model weight into any push toward the old highs, rather than chasing them. The 50-DMA near 7,600 is the support line that decides our next moves. If we hold it, and the uptrend off the spring lows stays intact, we can keep exposures near normal levels. However, if we lose that support on a closing basis, the next real floor sits much lower at the 200-DMA near 7,158. We suggest keeping some dry powder heading into the Fed rate decision and next Friday’s option expiration.
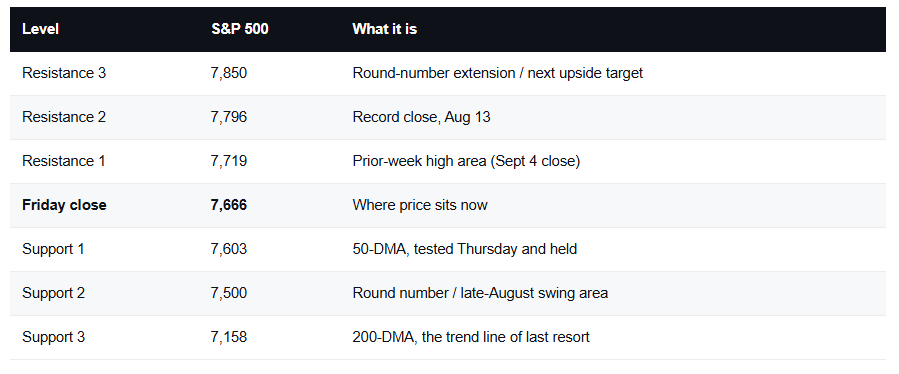
Heading into the end of the month and the quarter, there is one level that dictates portfolio strategy into October. A weekly close back above 7,796, the August record, says the buyers have reclaimed control. A close below 7,600 signals that the 50-DMA has failed and that the market wants deeper support. Everything in between is noise. And next week brings two catalysts big enough to force the break. Trade the level, not the narrative.
🔑 Key Catalysts Next Week
As mentioned throughout the commentary so far, there are two key events next week, and both are large enough to set the tone for the quarter. More importantly, they land 48 hours apart.
The first is the Fed. The FOMC meets Tuesday and Wednesday. The decision, a fresh set of projections, and Warsh’s press conference all hit on Wednesday afternoon. The market still leans toward a rate hike. However, as noted above, I think this week’s data made the call harder, not easier. A central bank does not like hiking into a 3.4% headline inflation print that was primarily a function of a temporary crude spike, so the real story on Wednesday may be who dissented, rather than the lack of a rate hike.
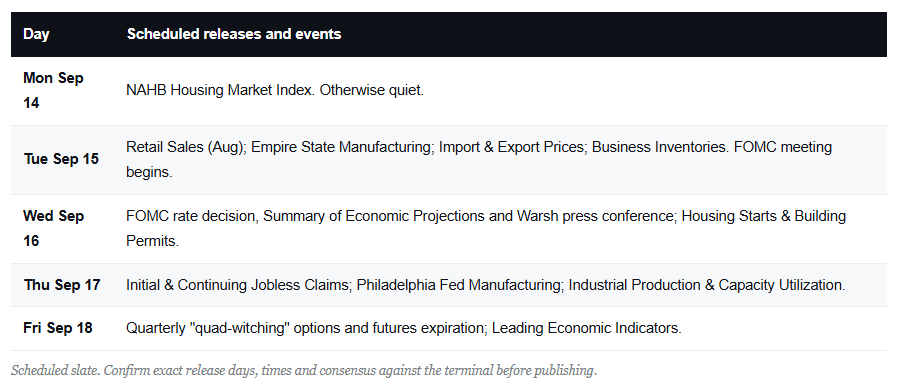
The second catalyst is purely mechanical. Next Friday brings the options and futures expiration, known as “quad-witching,” which occurs four times a year. Notably, this one is set up to be a record in size, which is unsurprising given the surge in options trading in the markets over the last couple of years. However, historically, expirations this large can pin price to the big strikes. Then they release it hard once they clear. Layer that on a Fed decision 48 hours earlier, and the week has a real setup for an outsized move.
The economic calendar around the Fed is full. Retail sales, industrial production, housing starts, the regional Fed surveys, and weekly jobless claims all print across the week. Retail sales carry the most weight. Consumer resilience is the last leg holding the soft-landing story together. A soft print would land badly, coming the morning after the Fed. There are no Fed speakers on the slate. The pre-meeting blackout window sees to that.
Earnings are thin in the gap between quarters, which gives macroeconomic data much greater weight. FedEx (FDX) is the marquee large-cap report, worth a look as a read on shipping demand and the industrial economy on Friday.
The asymmetric risk is a hawkish surprise from the Fed. Whether the market is priced for a hike remains to be seen. However, if Warsh delivers a hike, the rate-sensitive trade may have already priced it in, along with the bond market. In other words, a rate hike might turn out to be a relief for bond traders after all.


Comments
Log in or sign up to join the conversation.