

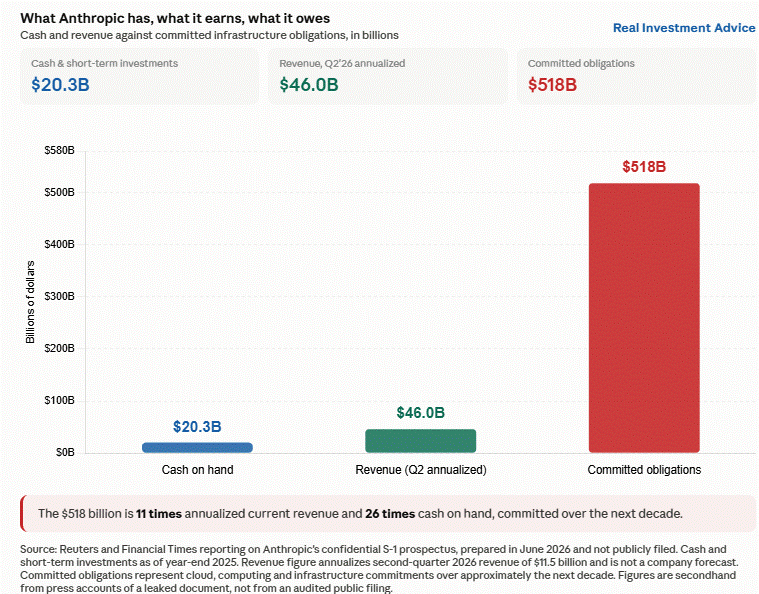
Anthropic’s leaked IPO prospectus, as reported by Reuters and the Financial Times, shows the company is growing faster than ever while committing to obligations that dwarf its earnings. To wit, annual revenue rose roughly 12x in 2025 to $4.6 billion, from about $400 million in 2024. Its first-quarter 2026 revenue was $4.73 billion, and its second-quarter revenue reached $11.5 billion. Annualized, that is roughly $46 billion or about 10 times its 2025 revenues. As revenues surge, so does spending.
Anthropic lost $8.06 billion on an operating basis in 2025, widening from $2.98 billion the year before, on $12.65 billion of operating expenses, including $7.33 billion for computing and infrastructure. The headlines tout a $42 billion non-operating net loss, mostly a $34 billion non-cash charge tied to the revaluation of convertible financing.
The number that may matter most is Anthropic’s firm commitment to spend $518 billion on cloud, computing, and infrastructure over the next decade. That compares against $20.28 billion of cash and short-term investments at year-end.
Compounding the dilemma for potential IPO investors, about 25% of 2025 revenue came from two customers, and the prospectus filing warns that many of its largest clients are not bound by long-term contracts and could cut spending.
The ultimate bet is that surging revenue growth eventually outruns its fixed commitments. The prospectus does not say what happens if it does not.
What To Watch Today
Earnings
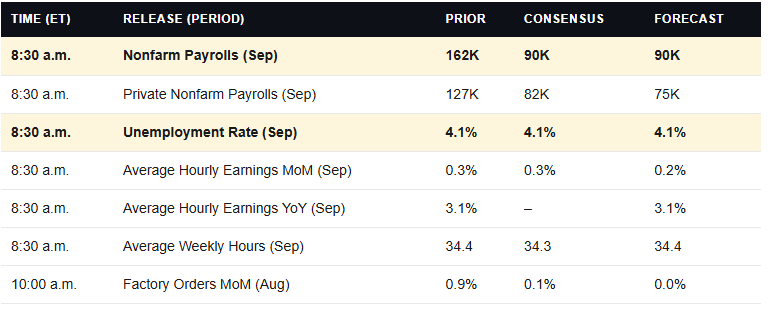
No notable earnings releases today.
Fed speakers: Dallas Fed President Lorie Logan (a 2026 FOMC voter) speaks at around 10:00 a.m. ET. The pre-FOMC blackout begins October 17 ahead of the October 27–28 meeting.
Economy
Market Trading Update
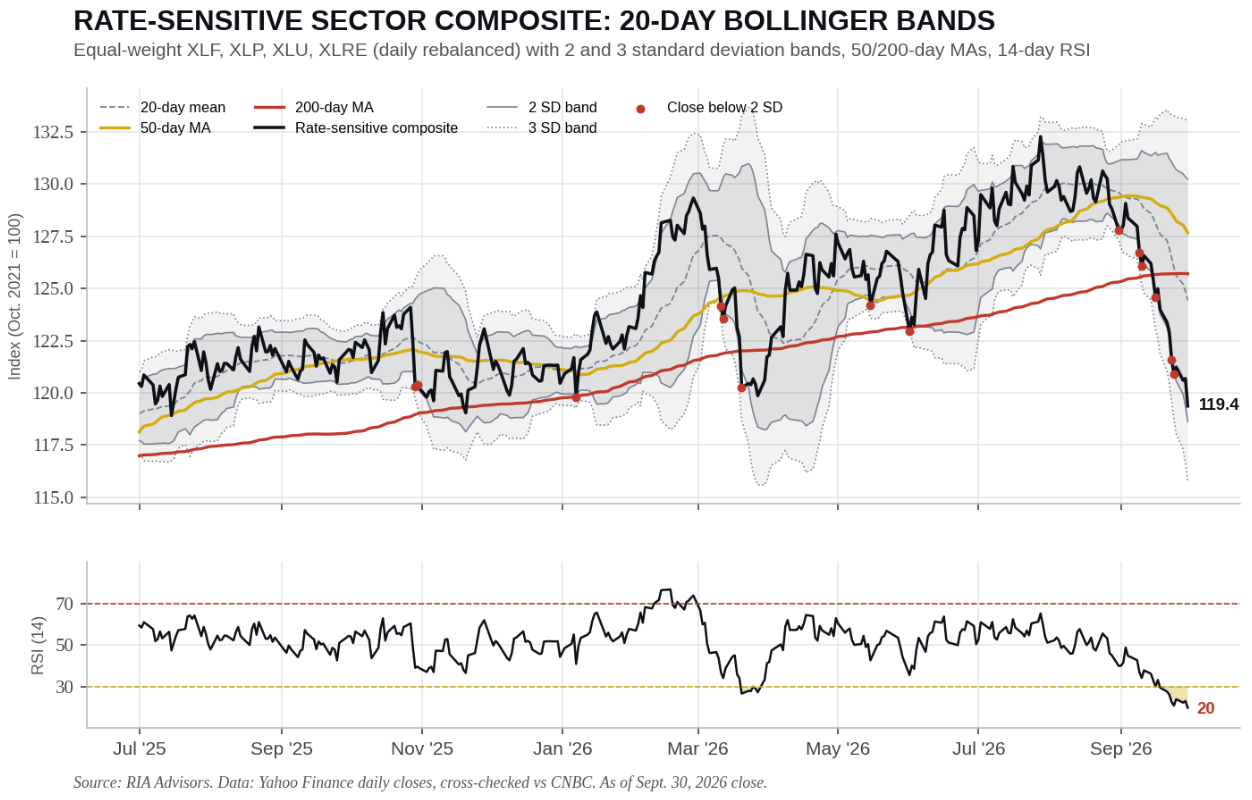
Yesterday, we ran Goldman’s “wall of worry” checklist against the tape and flagged real yields at their highest level since 2008. Today, let’s look at where that pressure is landing. The interest rate-sensitive sectors are now the most oversold they have been in five years.
To measure it, I built an equal-weight composite of Financials (XLF), Staples (XLP), Utilities (XLU), and Real Estate (XLRE). As of Wednesday’s close, the composite sits 6.5% below its 50-day moving average and 5% below its 200-day. Its 14-day RSI fell to 20, the lowest reading in five years. The index closed below its lower 2-standard-deviation band five times in September alone. Since August 31, each of the four sectors has dropped between 5% and 7.5%, while the S&P 500 barely moved.
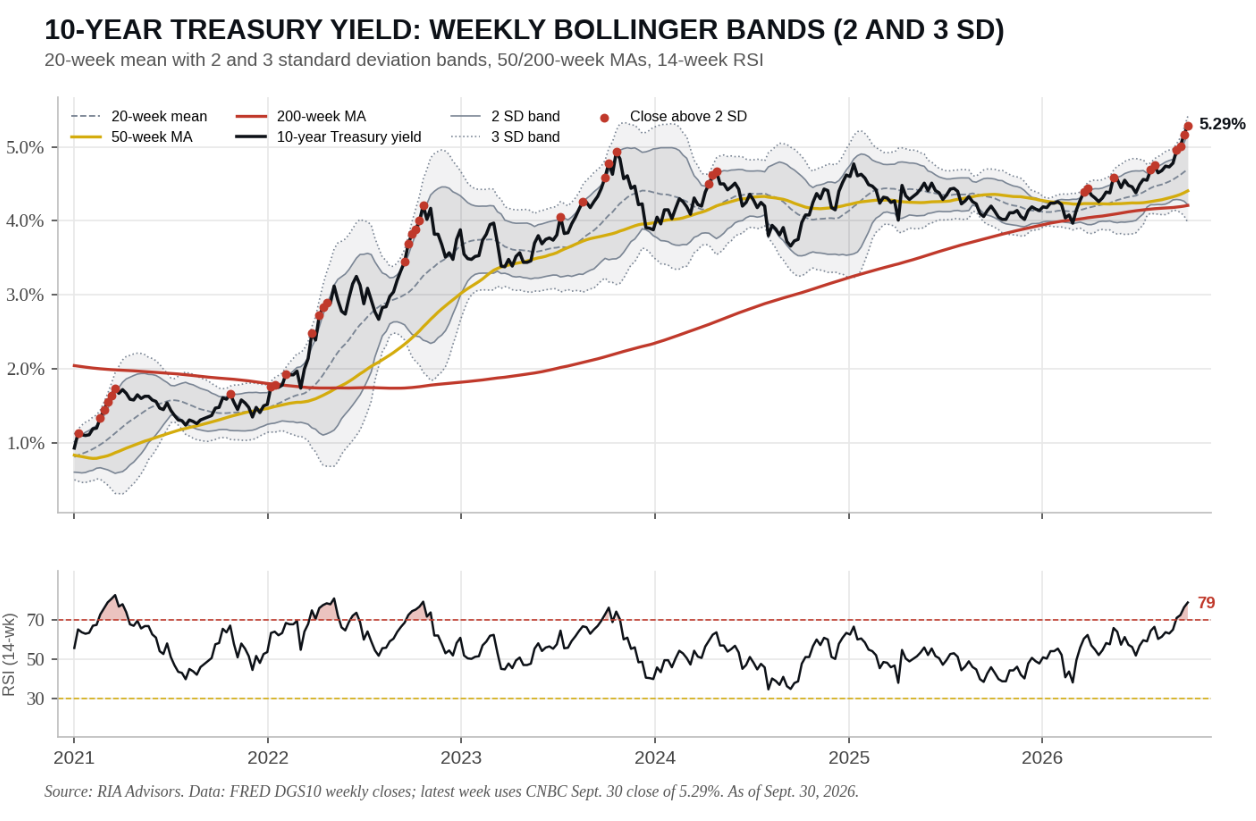
The cause isn’t a mystery. The 10-year Treasury yield closed Wednesday at 5.29%, the highest since 2007. On a weekly basis, that’s roughly 2.5 standard deviations above its 20-week mean of 4.70%, with the 3-standard-deviation band near 5.41%. Yields have jumped 51 basis points in four weeks, and the weekly RSI sits at 79.
Bob Farrell’s Rule #1 says markets return to the mean over time. Yields at these extremes tend to correct themselves because borrowing costs this high eventually choke off the demand that pushed them up. Housing, credit, and capex all reprice at 5% or more. Lacy Hunt has long argued that heavily indebted economies can’t carry high rates for long. When demand cracks, yields fall, and the sectors punished most by rising rates usually lead the rebound.
The skeptic in the room will ask the obvious question. “Can’t oversold, just get more oversold?” It can. I ran the history. Since 1990, the 10-year yield has broken above its upper weekly band in 27 separate episodes. Yields were lower six months later in 17 of them, but the median decline was only 13 basis points. In 2022, yields rose to a band higher for most of the year. A deviation tells you the move is stretched, NOT that it’s over.
The reversal also won’t be even. Utilities and REITs benefit most directly from falling yields. Financials are trickier. A rally driven by “demand destruction” brings credit losses along for the ride, and we recently discussed CMBS losses reaching the AAA tranche.
So don’t try to catch the bottom. Build the watch list now, favor Utilities and Real Estate over Financials, and add in tranches only when the composite reclaims its 20-day mean near 124 or yields close back inside the upper band near 5.18%. Size positions so that being early doesn’t hurt. Such is the price of buying what everyone else is selling.
Mortgage Rates Make Buying Homes Even Harder
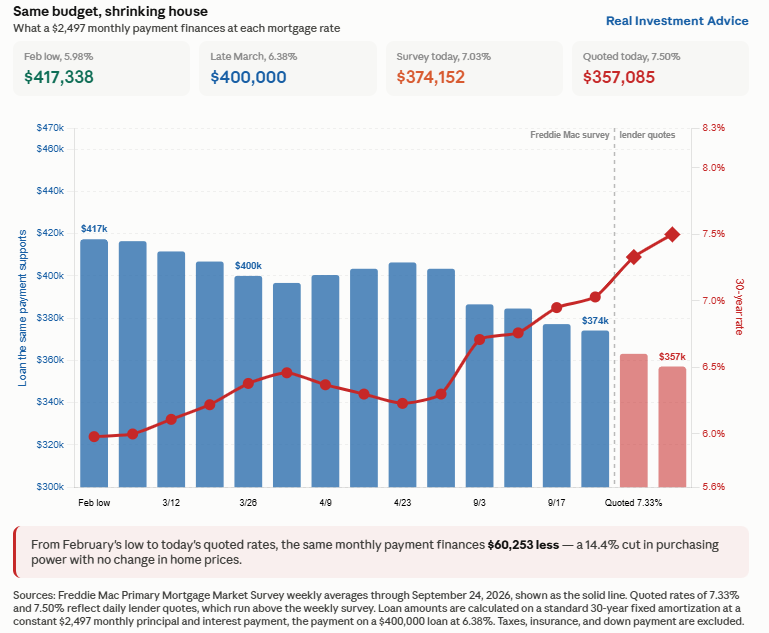
If many people’s ability to buy a home was limited six months ago, it has gotten even worse. Bankrate’s daily mortgage rate quotes are running between 7.33% and 7.50%, a full percentage point higher than they were six months ago.
To show the financial impacts, let’s take a $400,000 loan. At 6.38%, principal and interest run $2,497 a month. At 7.50%, the same loan costs $2,797 a month. That’s about $300 more every month, $3,600 a year, and between $91,000 and $108,000 in additional interest over the life of the loan.
The more useful framing bases the analysis on a constant payment rate, because most buyers think in terms of what payment they can afford. A household that budgeted at $2,497 a month could borrow $400,000 in March. At 7.50%, that same monthly payment supports a house value of $357,085. A 1% higher mortgage rate erased $43,000, or over 10% of purchasing power.
The graph below shows how mortgage rates and housing affordability have changed since the February low.
Tweet of the Day


Comments
Log in or sign up to join the conversation.