

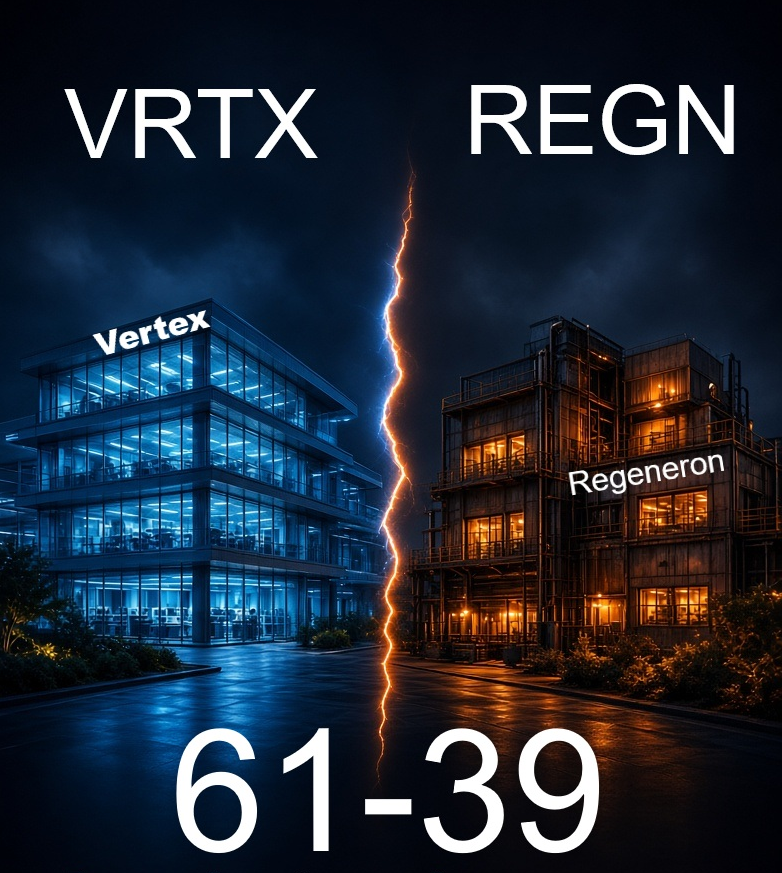
The headline score of 61–39 in favor of Vertex Pharmaceuticals (VRTX) over Regeneron Pharmaceuticals (REGN) initially suggests a clear hierarchy of fundamental quality. A closer reading of the SEC EDGAR-derived data, however, reveals a more nuanced tension: VRTX does not win by being the larger or more profitable company in absolute terms, but by demonstrating superior operational efficiency and capital-allocation discipline relative to its size. The comparison is less about which firm is simply “better” and more about which business model currently offers the more robust foundation for sustainable value creation. The data constrains any narrative of pure scale superiority and instead highlights the central role of return on invested capital and asset turnover in driving shareholder value.
At the core of VRTX’s advantage is its significantly higher Return on Invested Capital (ROIC)—the measure of how effectively a company generates profits from the capital it employs. VRTX’s ROIC stands at 22.03%, nearly triple REGN’s 8.20%. That gap is not merely statistical; it points to a material difference in resource utilization. In biopharma, where R&D outlays are large and commercialization cycles are long, a high ROIC suggests that VRTX is either extracting stronger margins from its existing portfolio or directing capital toward projects with more favorable risk-adjusted returns. REGN’s lower—but still positive—ROIC implies that a larger share of its capital base is tied up in operations that do not produce commensurate profit flows.
This reading is reinforced by Asset Turnover, which measures how efficiently assets are converted into sales. VRTX’s Asset Turnover of 0.44x outpaces REGN’s 0.34x. Taken together with ROIC, the figures indicate that VRTX is not only earning more per dollar of capital but also generating more revenue per dollar of assets. That efficiency gap is a principal driver of the 61–39 score and signals a business model that is less capital-intensive relative to its output.
Growth trajectories add another layer and undercut the assumption that higher absolute revenue automatically implies stronger prospects. VRTX is growing revenue at 10.35% year-over-year—more than double REGN’s 5.62%. The differential holds over a three-year horizon, with VRTX’s 3-year CAGR matching its current growth rate, consistent with steady and possibly accelerating momentum. For investors, that points to successful share gains or product launches gaining traction faster than Regeneron’s. Growth quality matters as much as pace: the Resilience Report shows both companies pass the Growth vs. Free Cash Flow (FCF) consistency check, indicating that VRTX’s expansion is backed by cash generation rather than accounting effects or debt-fueled spending. That distinction is material for assessing the durability of top-line growth.
VRTX leads on growth and efficiency, yet REGN retains advantages on selected profitability metrics, so the outcome is not unanimous across every line. REGN’s Operating Margin of 24.95% is below VRTX’s 34.77%, underscoring VRTX’s stronger conversion of revenue into operating profit. At the same time, REGN’s FCF Margin of 31.08% exceeds VRTX’s 26.61%. The apparent tension is explained by the gap between operating cash flow and capital expenditure: REGN generates more cash after funding its capex needs. REGN’s higher Operating Cash Margin (34.71% vs. VRTX’s 30.26%) points in the same direction. REGN’s model, while less efficient on capital returns, remains competitive on raw cash generation—possibly reflecting differences in working-capital management or capex timing.
Receivables Turnover sharpens the operational contrast. VRTX’s ratio of 5.62x is more than double REGN’s 2.18x, indicating faster collection of cash from customers. In an industry where reimbursement can be complex and slow, higher turnover supports liquidity, reduces credit risk, and speeds reinvestment. REGN’s lower turnover is not automatically a red flag, but it is consistent with longer collection cycles or a customer mix that requires more credit. The difference further supports the view that VRTX converts earnings into cash more rapidly.
The Sloan Ratio, which captures the accruals component of earnings, speaks to earnings quality. Both firms show negative Sloan Ratios—VRTX at −3.73% and REGN at −5.83%. Negative readings generally mean earnings are supported by cash flows rather than aggressive accruals, a constructive signal. VRTX’s less negative figure suggests slightly more cash-backed earnings, though both sit in an acceptable range. The Resilience Report confirms that both pass the ROIC vs. Sloan check, so the elevated returns—and VRTX’s 22.03% ROIC in particular—are not an artifact of financial engineering.
On valuation, the Discounted Cash Flow (DCF) model supplies a forward-looking view of modeled intrinsic value. It projects VRTX’s fair value rising from $261.63 to $309.54 over three years, and REGN’s from $707.73 to $867.27. The paths rest on each firm’s WACC and terminal growth assumptions. VRTX’s lower WACC of 9.97% versus REGN’s 10.18% is consistent with a modestly lower perceived risk profile, potentially linked to higher ROIC and steadier growth. VRTX’s terminal growth rate of 3.00% is slightly above REGN’s 2.81%, implying a longer assumed persistence of competitive advantage. These figures are model-based estimates of intrinsic value, not price targets, and are sensitive to growth and discount-rate assumptions; they should be read with that caveat.
Scale still matters in the comparison. REGN’s revenue of $14.34 billion exceeds VRTX’s $12.00 billion, and its FCF base of $4.46 billion exceeds VRTX’s $3.19 billion—evidence of a larger, more established franchise. Efficiency metrics, however, show VRTX extracting more from a smaller base. Share counts also differ: VRTX has 253.35 million shares outstanding versus REGN’s 94.41 million. Capital structure can affect per-share optics and dilution, but the core fundamental comparison centers on enterprise cash generation and returns, independent of share count.
Conclusion. The data support a clear ranking of VRTX over REGN on operational efficiency, growth consistency, and capital-allocation effectiveness. Higher ROIC, asset turnover, and receivables turnover point to a more agile, profitable model. REGN is larger and generates more absolute cash flow, yet lags on efficiency and growth momentum. Both firms operate in a heavily regulated, R&D-intensive industry where pipeline outcomes and regulatory decisions can dominate near-term results. DCF projections and consistency checks provide a disciplined basis for comparison, but they cannot fully capture binary drug-development risk. On the evidence available from SEC filings, VRTX is the more fundamentally robust company today; whether that ranking holds will depend on the durability of its growth and on how both firms navigate the structural challenges of biopharma.



Comments
Log in or sign up to join the conversation.