

Equities seem to be in the throes of the death of a thousand cuts at the moment. The rebound towards the end of January from the initial swoon was reversed last week, and at this point, a new low is all but certain.
There are a number of things troubling equities. Geopolitics are a fickle catalyst for anything, but it has certainly added to the misery in the past few weeks. A Russian incursion in Ukraine remains a distinct risk, an event which would force markets to discount the risk of a more sustained military conflict on the European continent, not to mention a further leap in energy prices.
The latter would intensify inflation fears, which are already weighing on markets in the context of the surge in bond yields, and the significant repricing in expectations for monetary policy, for both rates and QE. Investors could do with relief from these headwinds, but I doubt they’ll get it, at least not in Q1.
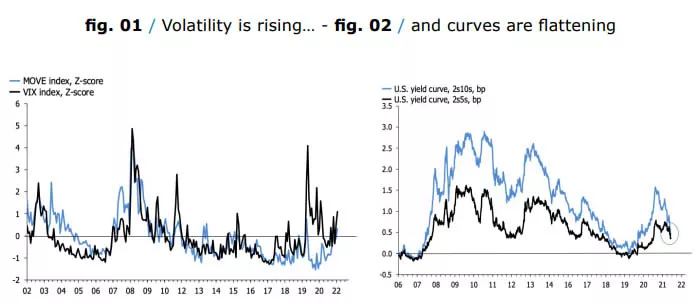
I’ll start with the two most obvious trends; rising volatility and flattening yield curves, the latter driven by a sharp repricing on the front-end. The first chart below plots Z-scores for the VIX and MOVE. Both are now clearly rising.
It’s interesting that equity volatility bottomed in late 2017 before the vol-shock in Q1 18, and it has been creeping higher since, even when factoring in the fall from the COVID-19 peak, as the market roared back once policymakers opened the floodgates by Q2 2020. The VIX is now approaching territory usually associated with investor-humbling spikes, such as the ones observed during the GFC, the euro area sovereign debt crisis, and COVID-19.
In this sense, the MOVE is more eye-catching. The Z-score shown below has been below zero through most of the pandemic, but those days are now gone, and they are not coming back anytime soon. This shift has occurred in the context of a broad-based rise in bond yields, though the key story is the flattening yield curve.
Even the 2s5s have now given up the ghost as the street piles on rate hikes onto their forecasts. This shift has, naturally, elicited warnings about a looming policy mistake by the FOMC. That’s understandable, but unhelpful. As I explained here, if you face an inflation problem and can’t move the supply side, your only choice is to lean on demand.
Interestingly, we should soon get a test of how markets perceive medium-term inflation pressures, and whether the Fed is about to hike the economy into recession. Specifically, I am thinking of QT, and the prospect of the Fed running of its balance sheet by as much as $1 trillion in the second half of the year.
This can go two ways. Either the whole curve shifts higher, consistent with strong underlying inflation pressures, or it inverts, hinting that the Fed was overdoing it, even before considering QT. Both likely would be a challenge for equities, but it’s possible that the former would support further outperformance in the value factor, most recently propelled by a strong rebound in old-school energy and commodities.
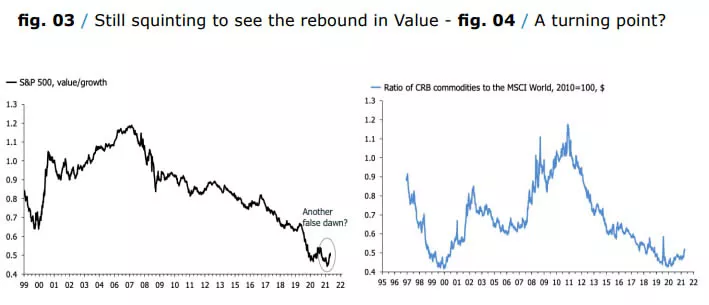
In this sense, it’s important to note that for all the focus on the recent outperformance of value equities and commodities, the two charts above show that it is nothing more than a blip, for now. For the market as a whole, I see only tentative signs that value is being created.
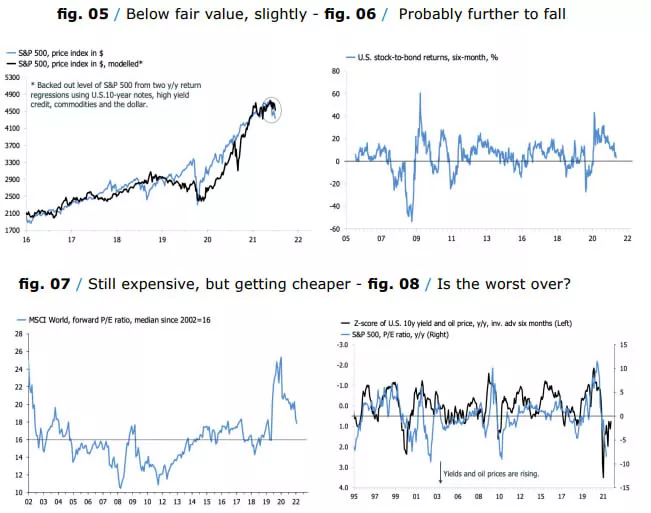
My APT model currently sees fair value for the S&P 500 at 4525, some 4% above its closing price on Friday. But this signal comes with a word of warning. The mean reversion is a key part of this model, and the recent fall in the model’s implied price below the actual price follows a very long period during which the S&P 500 was running consistently above its implied value.
The stock-to-bond ratio sends a similar signal. It is rolling over, but previous experience suggests that it has much further to fall before a meaningful buy signal is visible. We see the same signs in headline valuations.
The forward P/E, here for the MCSI World, has come down significantly, but it remains well above its median since 2002. Finally, the pace of multiple contraction seems to have peaked, though the change in yields and oil prices still point to a falling P/E ratio. In short, investors probably will have to endure the thousand cuts for a while longer.


Comments
Log in or sign up to join the conversation.