

Image Source: AbsolutVision on Unsplash
You may have enjoyed the adventures of Garrett Baldwin, soccer parent and coach, in previous newsletters. Well, this time, we ramp it up to a whole new level - as Garrett the Lacrosse Dad enters the building.
I served two decades in the ranks as a lacrosse goalie, and this weekend, we have my daughter’s first game that will require goalies. Who has volunteered for service today as a goalie on her team’s defense? Miss Amelia Baldwin. “I think I’ll try,” she said, “I’m a little bit scared.”
This is going to be something else.
Speaking of the goalie, we'll turn our attention to the state of momentum. There are currently three problematic domino chains to consider. I laid out all three recently, and I'll discuss more on Monday. They’re all connected to these issues:
SOFR/Repo Plumbing: SOFR and SOFR-linked benchmarks underpin well over $200 trillion in financial contracts. The entire system refinances trillions in leverage every morning with no grace period. If it spikes and stays elevated for even a few days, everything reprices in real time.
Treasury Basis Trade: Hedge funds have built roughly $1 trillion in leveraged Treasury basis positions, borrowing overnight to arbitrage Treasuries against futures. If funding costs spike, forced selling of Treasuries triggers more margin calls in a self-reinforcing loop.
Private Credit: A $2 trillion largely unregulated market. Several large managers, including BlackRock, Blackstone, and Morgan Stanley, have recently limited or gated redemptions in some private credit vehicles.
Commercial Real Estate: Roughly $875 billion in debt matures this year, most originated at 4% and now needing to refinance at near 7%. Office CMBS delinquency rates range from 8% to 12%, depending on the source.
Oil and Energy: WTI above $95 amid Hormuz disruptions, while AI-driven electricity demand pushes power prices higher. The Fed cannot cut rates to help the financial system if energy keeps feeding inflation.
Consumer Credit: Credit card debt at $1.28 trillion, delinquencies at the highest level since 2017, and auto loan defaults are rising. Lower-income consumers have largely burned through their pandemic-era savings.
AI Valuation Concentration: The six largest companies account for roughly 30% of the S&P 500, while 95% of organizations investing in generative AI are reporting little or no measurable return so far. A 20% correction in those names drops the index 6% on concentration alone.
Yen Carry Trade: Japan’s 10-year yield is near an 18-year high with hundreds of billions in carry trade still outstanding after only half unwound last August. A full unwind forces simultaneous liquidation across equities, Treasuries, and emerging markets.
Sovereign Debt Spiral: The US spends over $1 trillion a year in interest, borrows about $50 billion a week on average, and every issuance competes for space in the same strained repo market. The dollar’s share of global reserves has dropped.
Let’s now take a look at some charts.
Chart No. 1: The State of Momentum
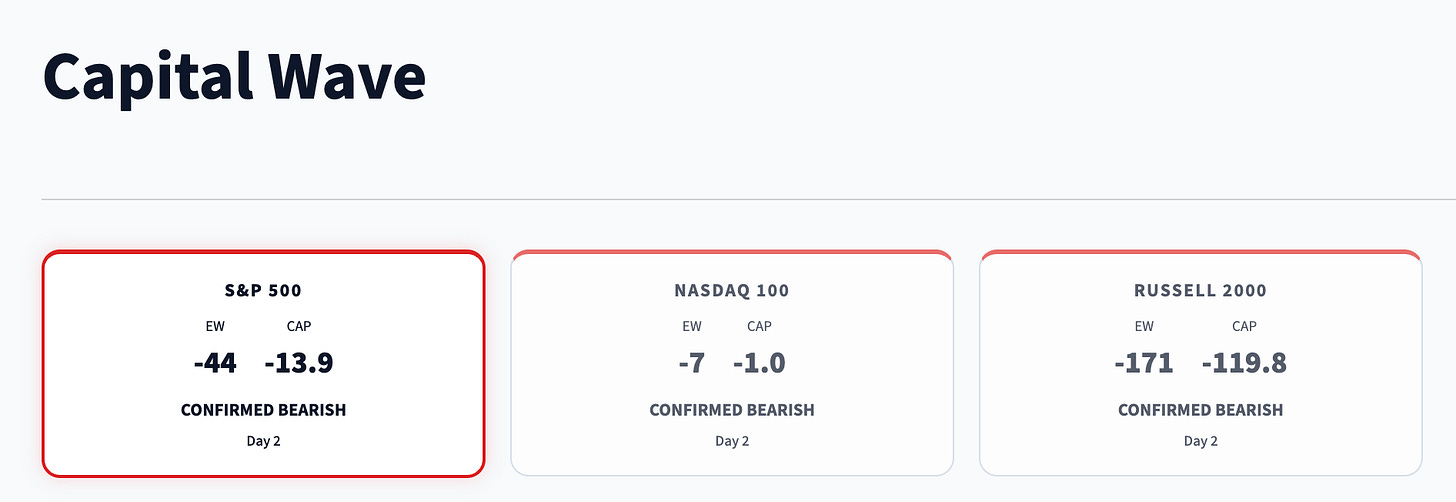
Paid subscribers got to have access to the full overview of the state of momentum. Here is just a snapshot of the state of momentum for all S&P 500 and Russell 2000 stocks.
Chart No. 2: Breaking Support
This is a really important sign of the liquidity cycle. We peaked at the end of the third quarter, and since then, markets have traded around key technical levels, such as the 100-day moving average and ranges. We bounced between 6,800 and 7,000 multiple times -- creating a frustrating range that has given us very little joy in one chart.
Now, we’ve really cracked under 6,800 again, for the first time since November.
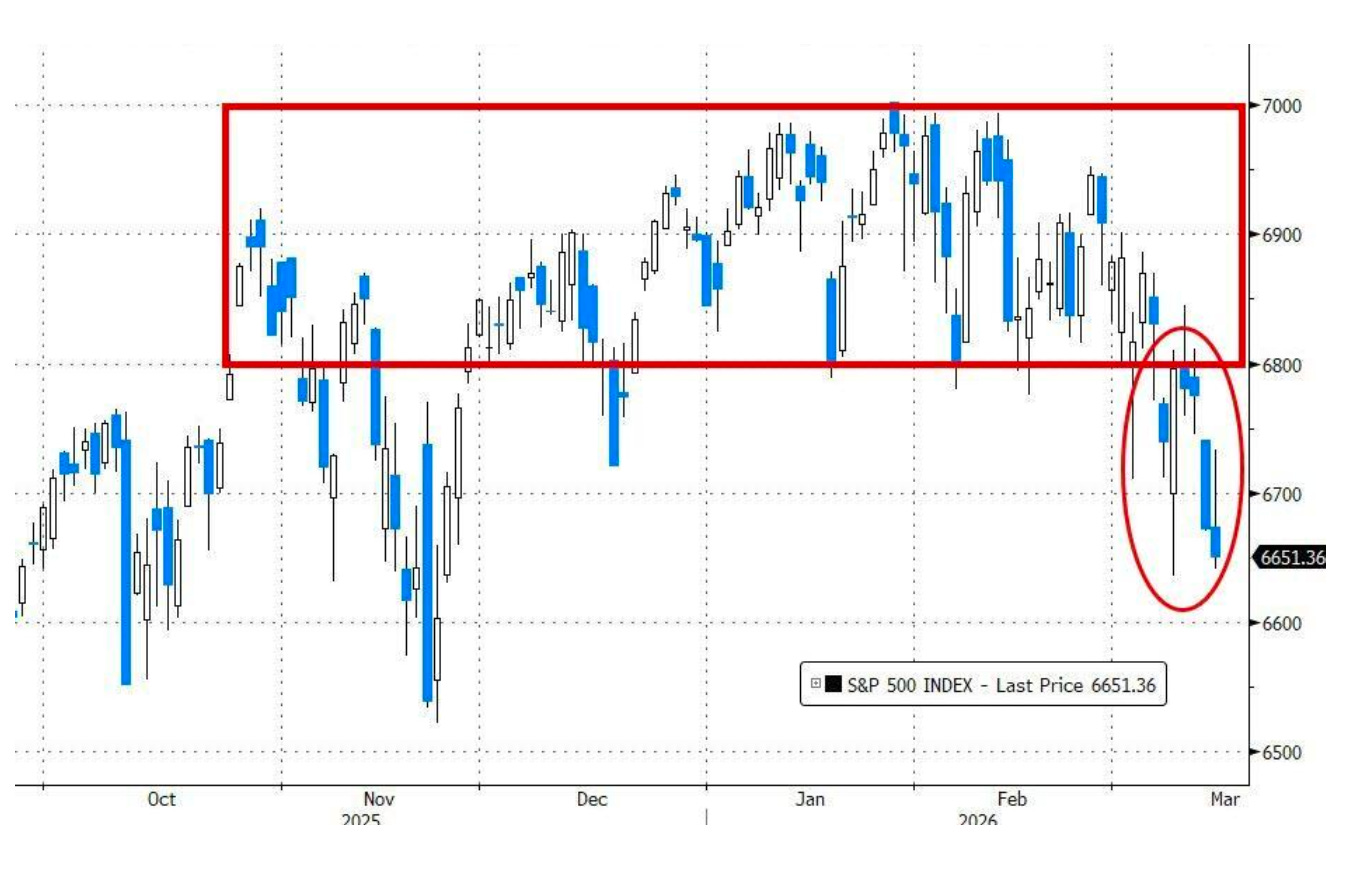
Image Source: ZeroHedge, Syz Group, and Bloomberg
I must stress the importance of that November downturn. It ended because of monetary policy. The Federal Reserve didn’t do anything; the Bank of Japan did, as it announced about $117 billion in stimulus at the time.
This is important because forward guidance will be the most important action of next week. Not capital injections, but statements from the Federal Reserve and the Bank of Japan.
If the Bank of Japan raises interest rates next week, all hell could break loose. I’m expecting some order, comfort, and guidance, meaning someone is going to lie to me and tell me that everything is okay.
But right now, barring any monetary or fiscal policy support, this market faces the real threat from the Bank of Japan’s policies, the risk of ongoing liquidity mismatches in private credit, and deeper concerns about rising oil prices in major economies. I said earlier this week that I’ve only had this feeling of uncertainty and concern three times in my life. The day after Lehman Brothers collapsed, the week after our momentum signal turned negative in February 2020, and right now.
If the Fed can’t come to the rescue right now, we’re going to see valuation compression start to pick up, and a lot of people will claim that no one saw this coming. That’s interesting, because I have been writing about this for months.
Chart 3: The Most Important Chart in Finance Right Now
The Invesco DB US Dollar Index Bull Fund.
It’s one of the best instruments to trade in the world because there’s no real volatility, and you only need to pay a few extra pennies on in-the-money calls to purchase time. So instead of paying $2,789 for 100 shares, you can effectively purchase April 17, 2026 calls for $0.93 ($93).

The world can’t use a stronger US dollar, and yet, here we are. If the UUP goes back to $29, we will have problems. As I’ve explained, a rising dollar is a serious problem because it impacts the refinancing of international debt. A drop in currencies against the US dollar means that those foreign debt holders need more of their local currency to afford dollars.
At the same time, the US has about 13% of its GDP that needs to be refinanced across the economy. That’s a lot of demand for refinancing and thus dollars. More demand means a higher dollar.
And again, people flock to the dollar as a haven in periods of tightening liquidity. This creates a paradox where, even though we talk about debasement (and its included inflation), we are happy to be in cash because everyone else wants cash.
Why would we want cash? Well, let’s check the scorecard on everything that's been happening.
Chart 4: There’s Only One Way Out
This chart tells us how ugly it’s gotten. The cost of downside protection is among the highest levels of the post-2008 era. You know what almost every one of these crises ended in?
A massive policy accommodation from a major central bank. Isn’t it fun to go from one crisis to the next?
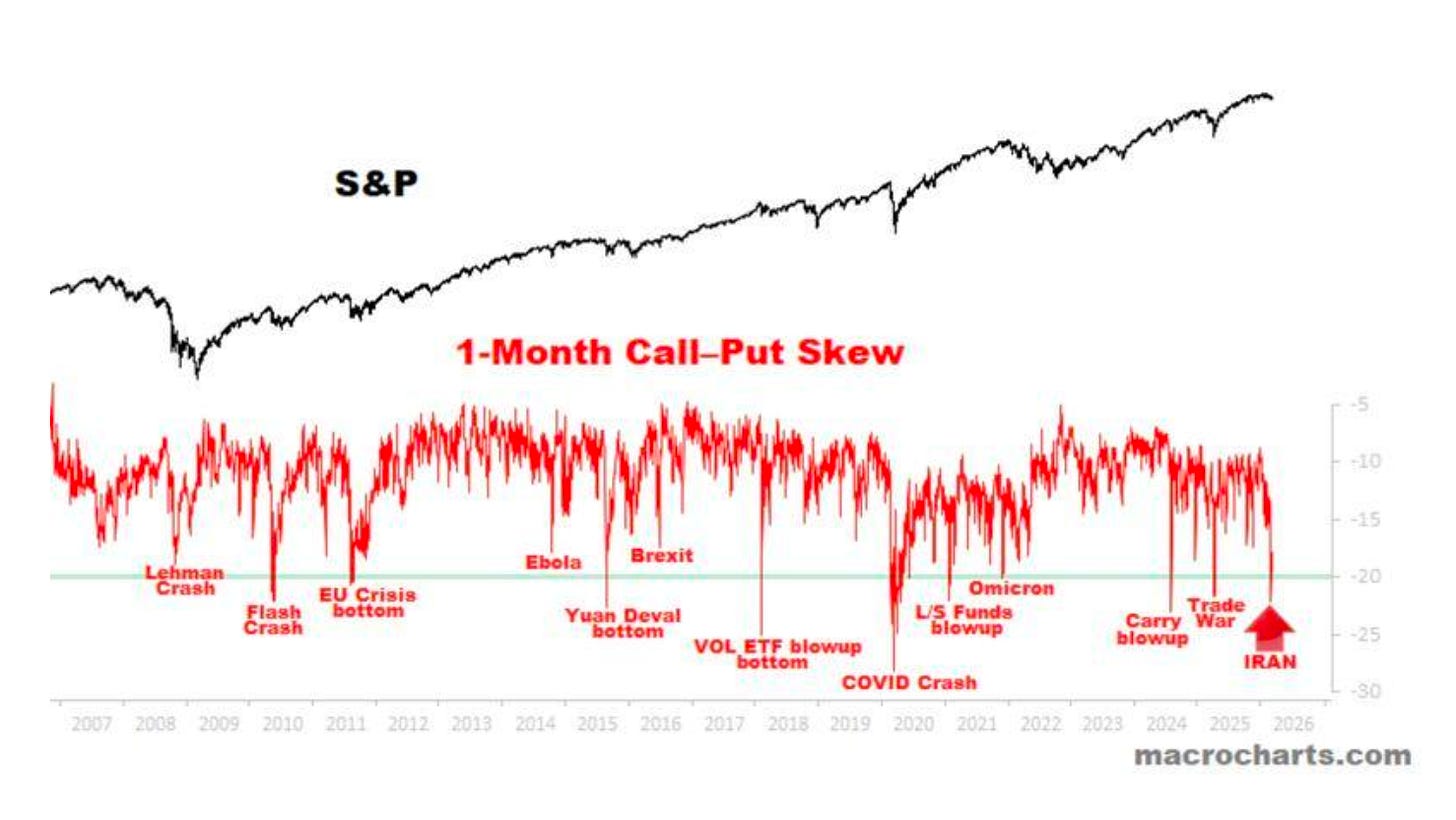
Image Source: The Chart Report
Flash crash, Ebola, and the implosion of Archegoes didn’t seem major, but they occurred during periods when liquidity cycles were expanding.
But Lehman, EU, Yuan devaluation, 2018 volatility, COVID-19, the August 2024 carry blow-up, and the Trade War all ended in some policy relief -- and all involved deeper concerns about leverage and surging government borrowing costs.
Our momentum breakdown stocks have been screaming about private credit and regional banks for weeks. Which means one thing: we will only get out one way, and it's with the sound of a money printer humming.
For those who don’t think that monetary policy accommodation could come, I must remind you that the Bank of England went from tightening to printing in a week in 2022. And I can reasonably argue that it will be necessary because we’re not just facing one crisis right now.
Chart 5: Oh, Boy
The worst sector this year is the financial sector. And it’s not just private equity and private credit names. Regional banks are getting beaten up a bit, down 3.2%, with the worst coming in Huntington Bancshares (down 15% in a month), Truist (down 19% in a month), and Fifth Third (down 20%).
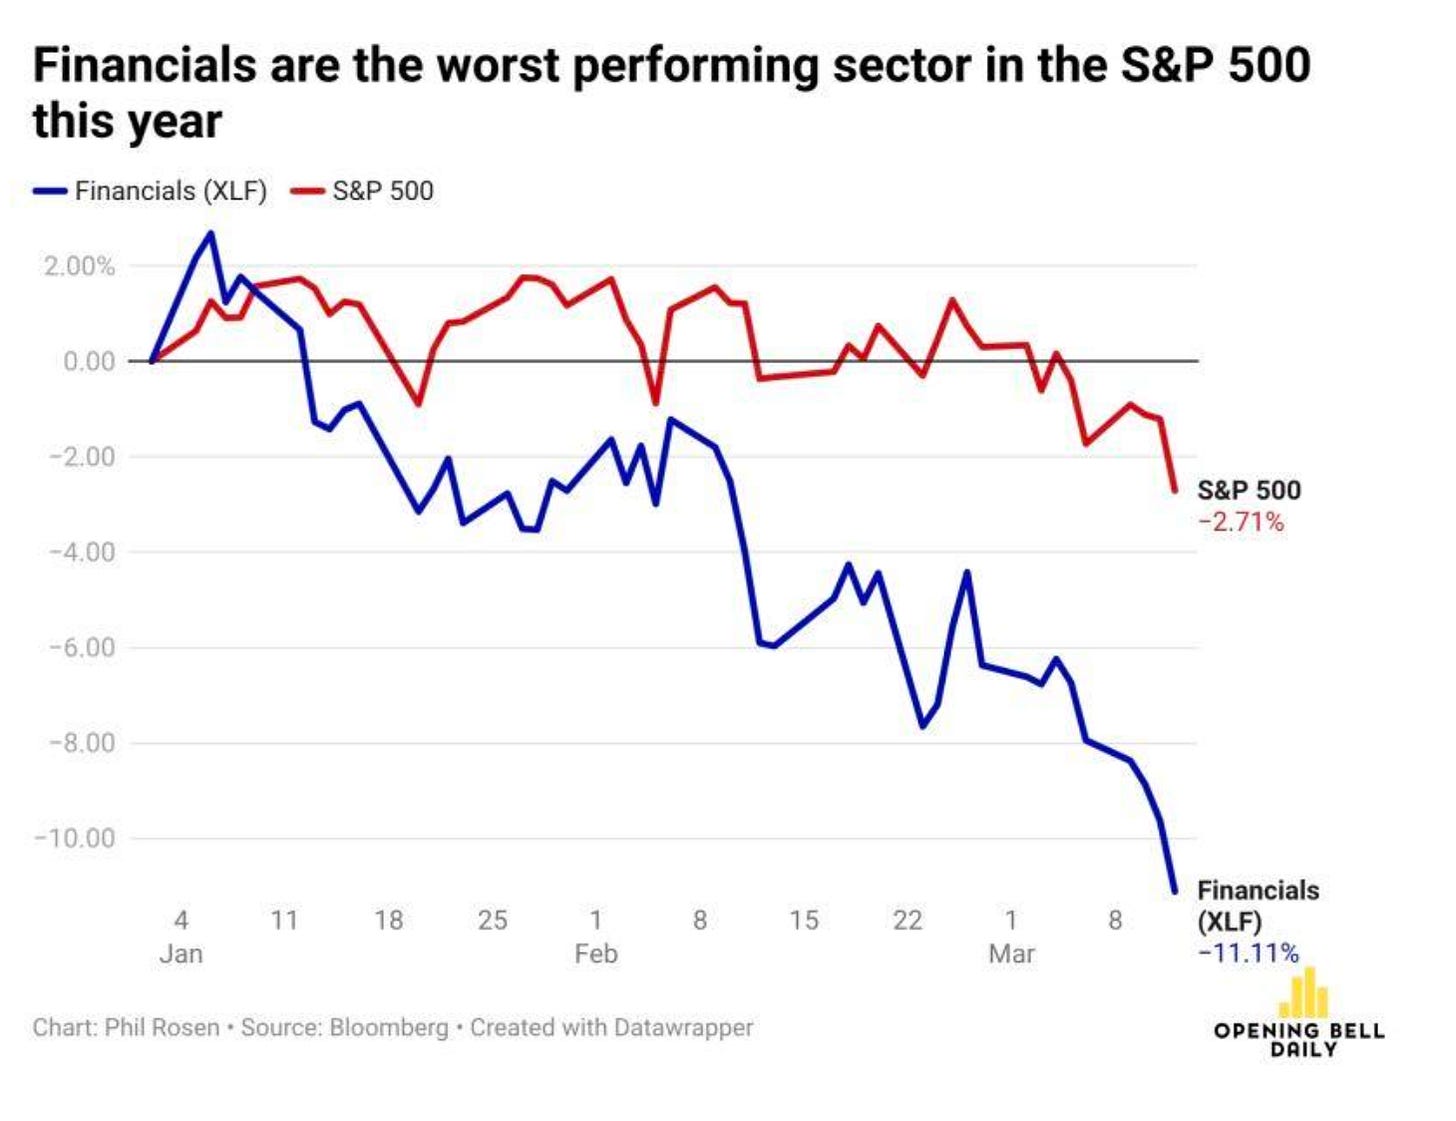
Now, let's have a fun thought experiment. Where would these stocks be if the Federal Reserve wasn't pumping $40 billion to $55 billion a month to prevent stress in banking reserves?
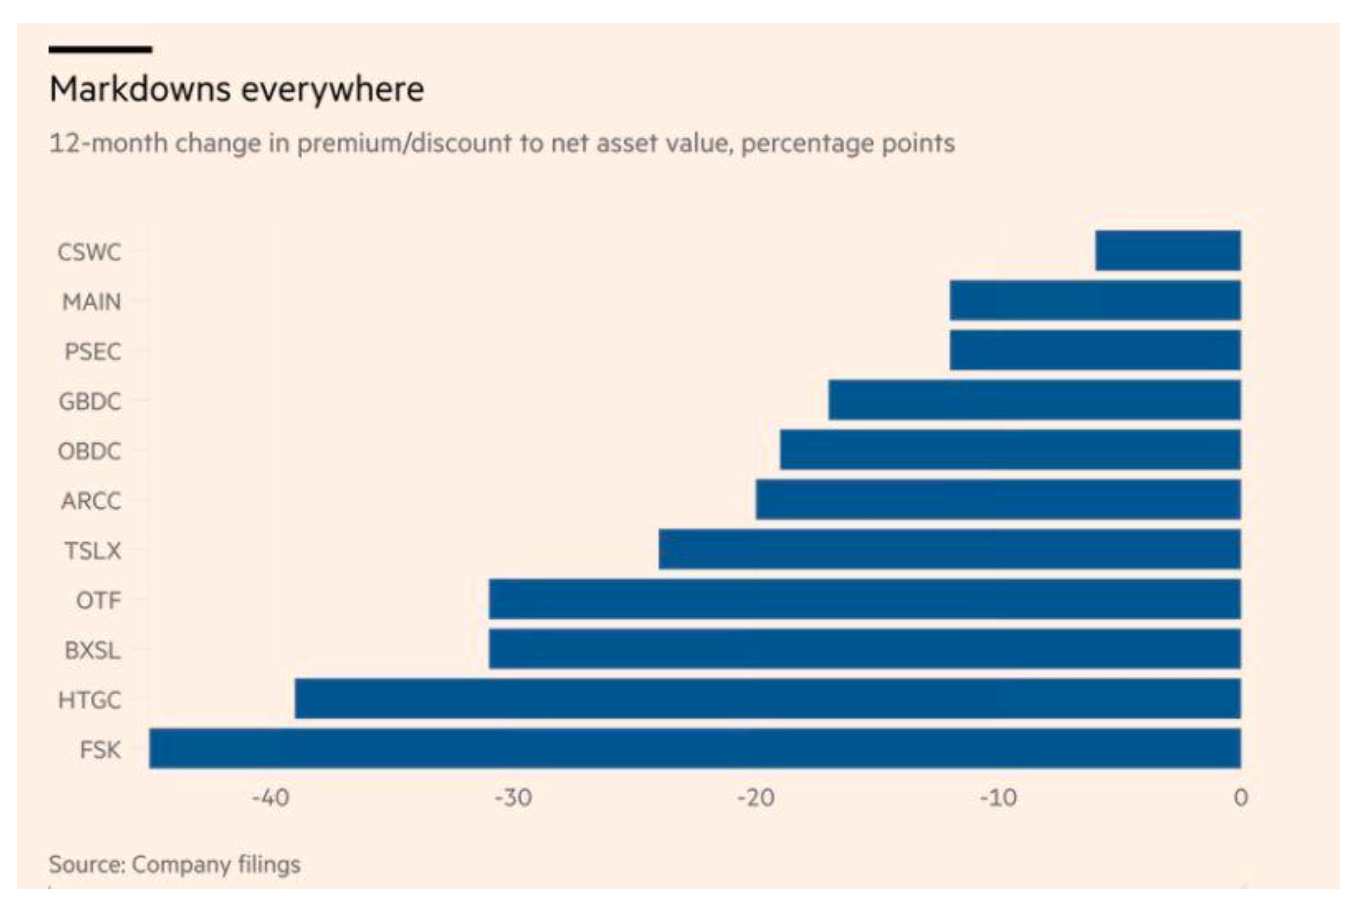
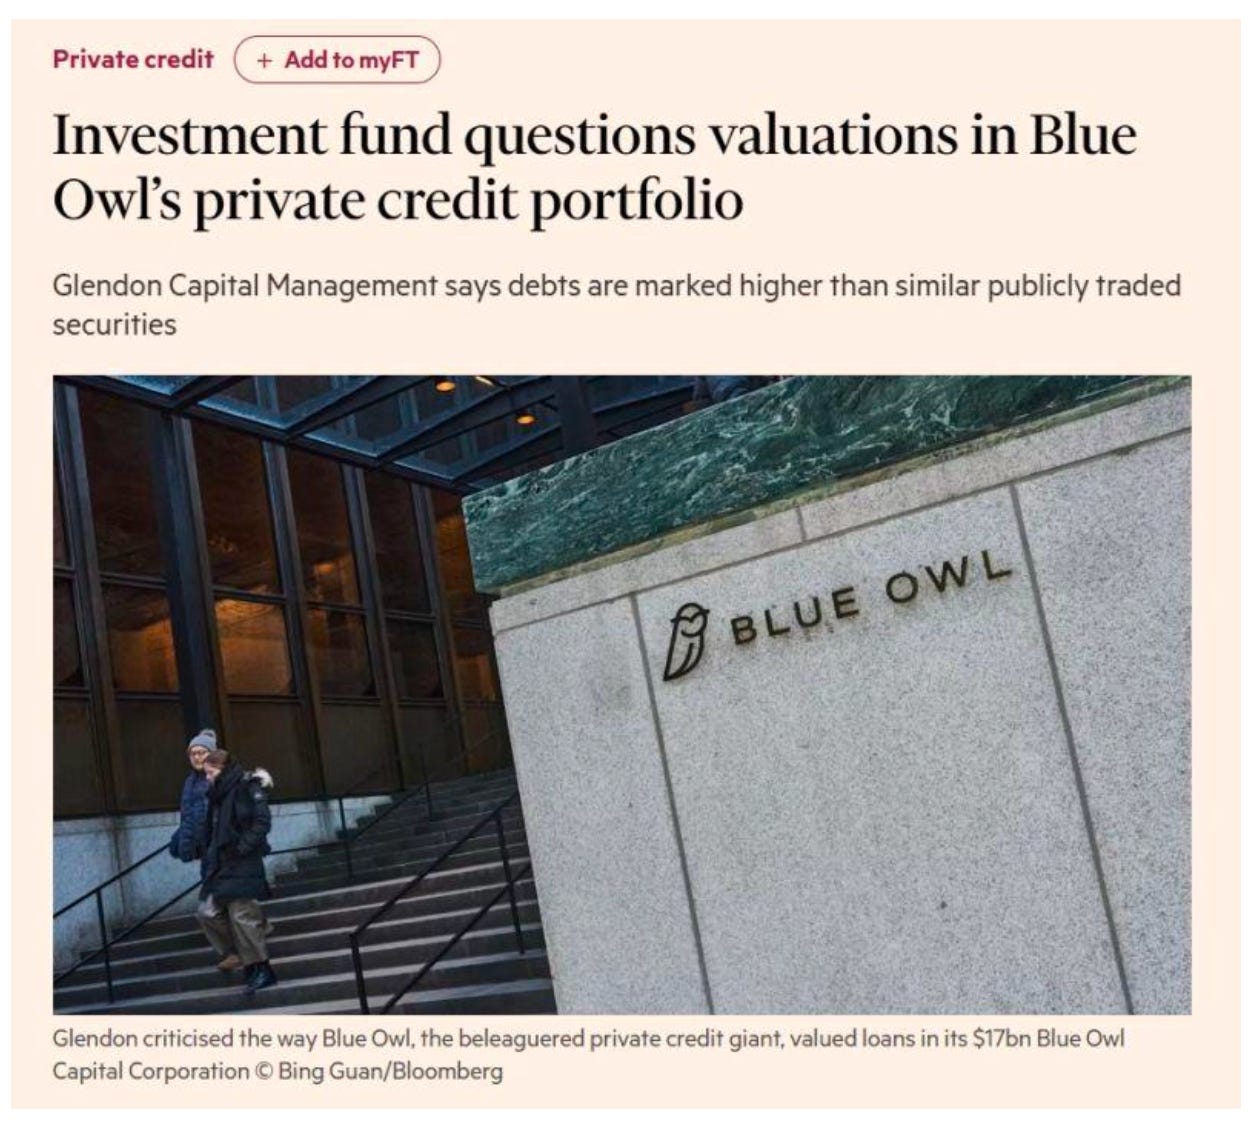
Chart 6: Private Credit at This Point
I had a conversation the other day with a friend of mine of 25 years who worked in the international oil markets.
A few years ago, a company in London called him to ask him for consulting services. He was focused on a semi-liquid private credit vehicle that linked its cash flows to oil production out of Africa. The vehicle was insane in its structure, with ties to the Republic of the Congo, Liberia, and a few satellite offices in Eastern Europe.
Lots of nepotism, combined with whatever was needed to sell to a pension system in Western nations. The company that was looking at this deal asked him to evaluate the assets and the cash flows. This was his first exposure to private credit.
Turns out the assets were marked up about 12% above their valuation. But who cares, right? It’s marked to model -- and even if the model were pumped up, so long as there wasn’t a run on the fund, it would hold up.
“Garrett,” he said. “The second that I heard that private credit was expanding like this across the US, I’d estimate that almost everyone overvalues the assets.”
This isn’t just about loan quality. This is a problem with underwriting, fees, and whatever story needs to be told. A good team of forensic accountants and journalists could track down a lot of paperwork and begin assessing actual valuations. And I’d bet they’d uncover something bigger. This chart is absolutely brutal.
But let’s be serious, the government’s not going to do that. Most editors don’t even know what private credit is, and managers will play stupid and say that they trusted other people to give them the information. They just manage the money, right?
It’s bigger than it seems.
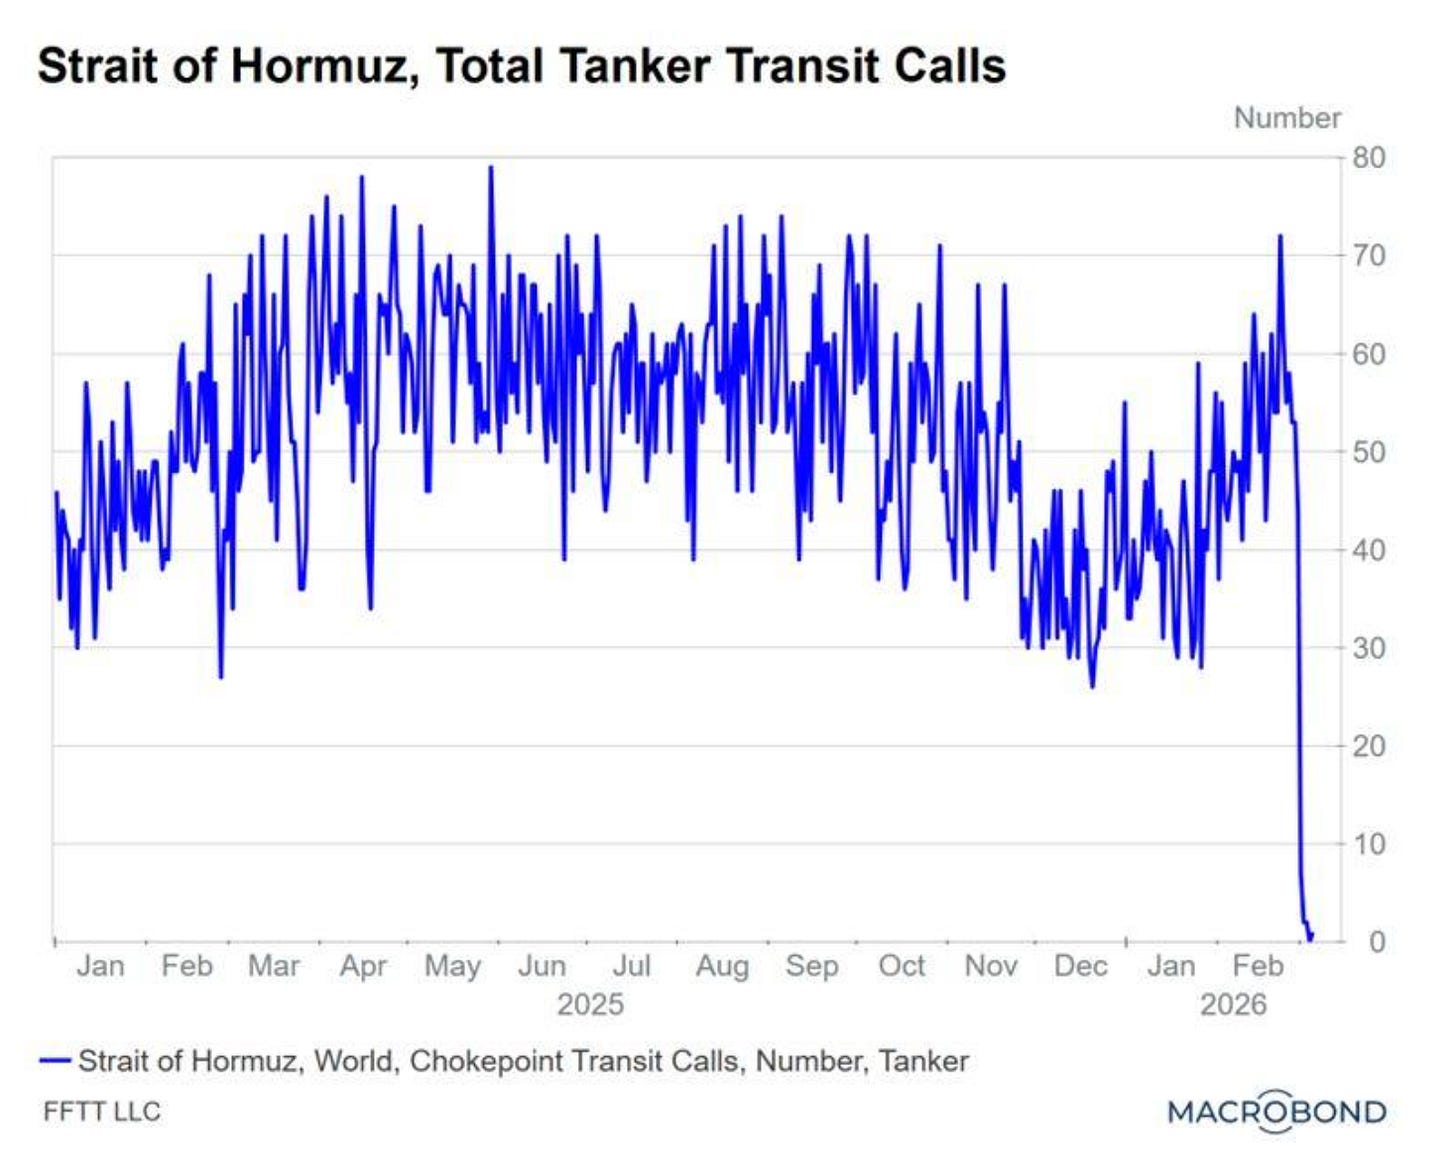
And Finally No. 7: No Ships
It has been stunning to watch the Strait of Hormuz shut down, and the paralyzing impact on oil prices and the global shipping markets. The thing that really bothers me is that fertilizer prices are surging, and that will have a dramatic impact on food in the coming year. As I noted last week, the MENA region can anticipate much higher food prices than the already forecasted 10% bump economists expected this year.
In case you missed it, I did a 40-minute presentation last week on the impact of the war on commodity markets.
I know it’s a lot. But as always, I’m sitting here, eager to watch my daughter play lacrosse and enjoy the little moments. We can’t control the things happening in this world that are outside our reach. That’s why we depend on our momentum indicator to help guide our investing and trading decisions -- and we focus on the things we can control: Our health, our wealth, and ourselves.
I hope you have a wonderful weekend.

Comments
Log in or sign up to join the conversation.