


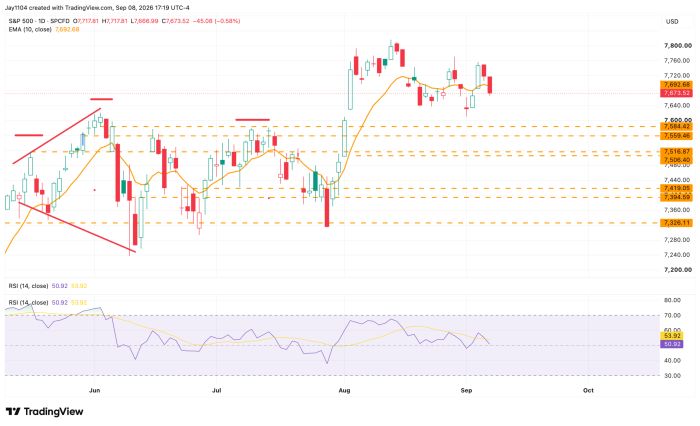
The S&P 500 (SPY) fell about 60 basis points on the day—hardly an exciting move. Given where the index stands, there isn’t much to say unless it breaks below 7,600. For now, it could remain range-bound or potentially retest the highs. If this market calm persists.
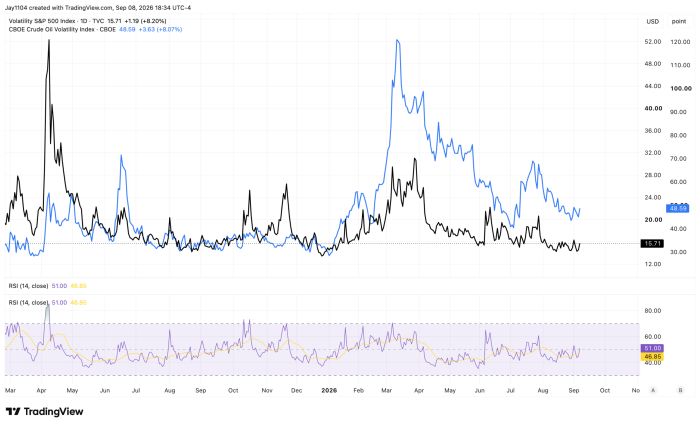
Volatility was largely a nonfactor today. However, as I’ve said many times, it remains very low, especially when looking at implied correlations. At this point, a macro shock—or simply a couple of days of selling pressure on the index—could trigger a sharp, rapid increase in volatility. One thing to watch is oil volatility; if it starts rising, it could pull the VIX higher.
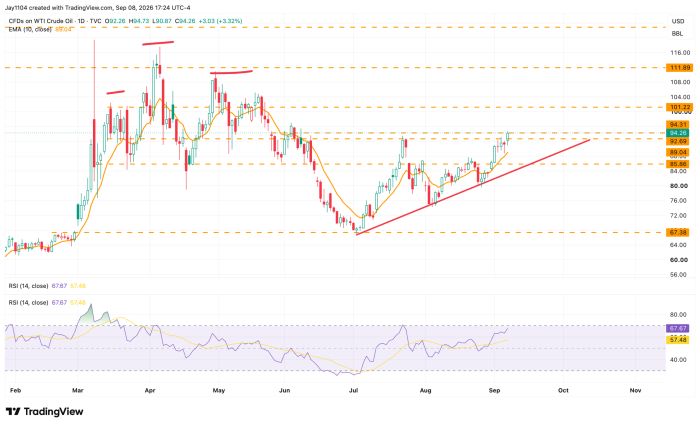
Meanwhile, WTI crude appeared to break through resistance at $93 today, potentially clearing the way for a surge back to $101. An ascending triangle pattern also appears to have formed, supporting the bullish case for a move to $100 or higher.
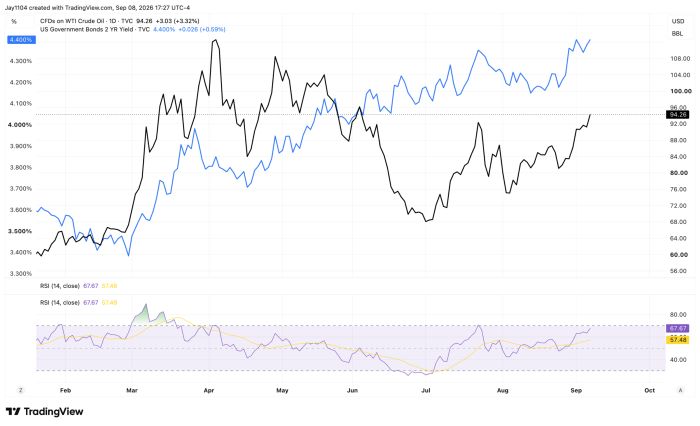
Higher oil prices will likely push the 2-year Treasury yield higher as well. Oil prices and the 2-year yield have trended together over time, and I don’t see why that would change now. I think we’re in the part of the cycle where front-end rates rise faster than long-end rates as the market begins to price in the potential for Fed rate hikes.
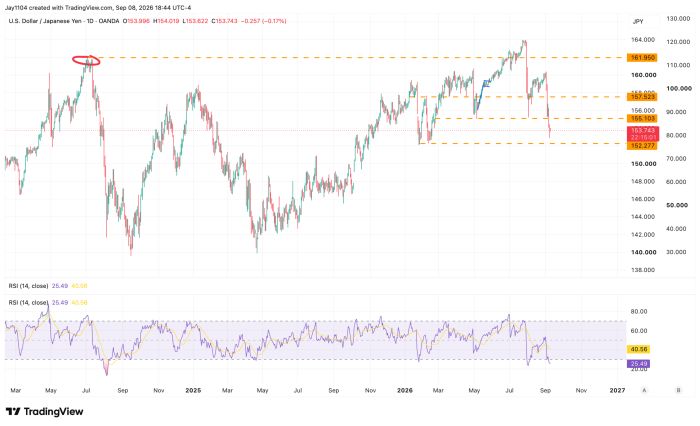
Finally, USD/JPY has broken below support at 155 and is now threatening to fall toward its next support region around 152. A stronger yen will eventually pose a problem for markets, especially if it begins to weigh on Japanese equity prices. More importantly, yen strength has led to increased volatility across global markets in recent years.



Comments
Log in or sign up to join the conversation.