

Image Source: Jakub Żerdzicki on Unsplash
I'm still in shock that the stock market gapped up and then took off to new highs starting two weeks ago.
To explain this rally, I'm in agreement with some of the people on CNBC who believe that bearishness had gotten to the point where there was no one left who was willing to sell, and then when the market started to turn upwards, short covering created the fuel for the rocket ship price pattern we are seeing.
All eyes are now on the 7000-level for the SPX. If this level holds, then the rally is for real, and those of us who are skeptical will need to change our mindsets and get with the uptrend. But if the SPX falls below 7000, then I think the caution is justified and we should be positioned and ready for the possibility of another leg down.
My short-term position remains at about 50% cash, and Investors.com recommends about 10% cash short-term.
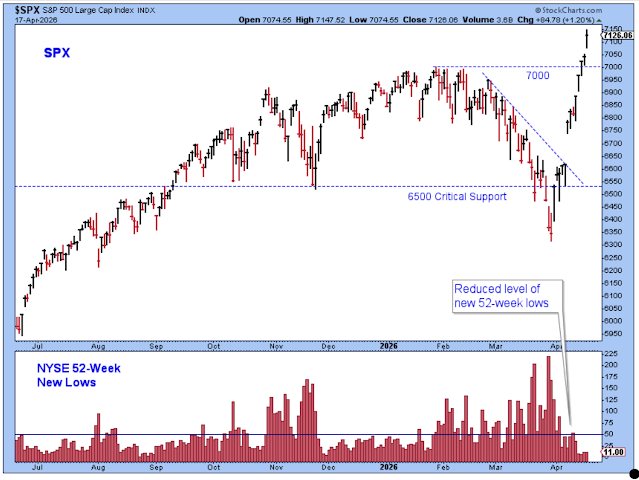
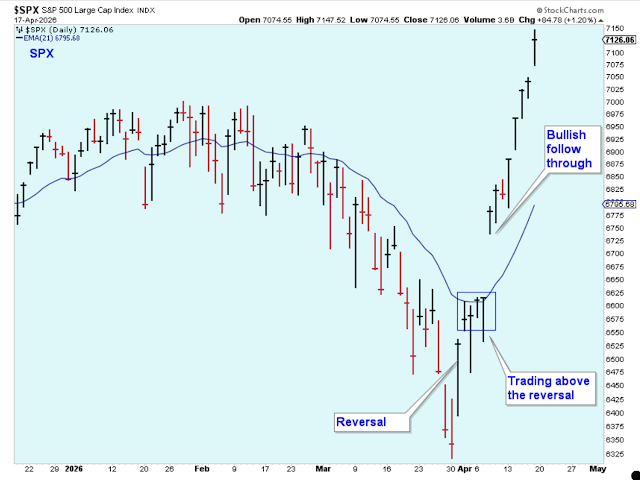
Here is a picture of the recent market action that got us to this level for the SPX.
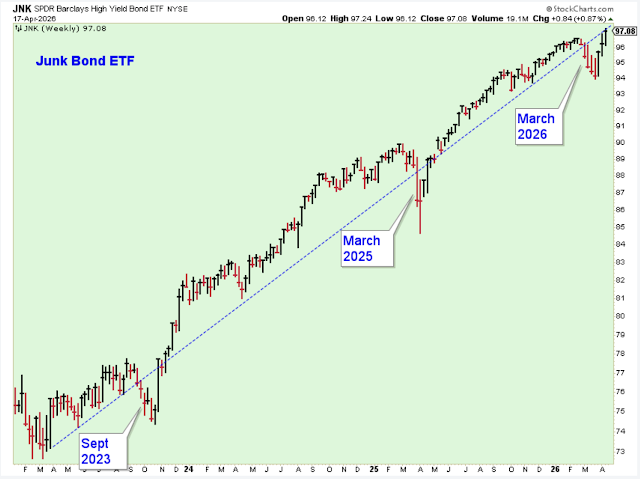
The price of this junk bond ETF has recovered nicely to new highs, and it should be giving me added confidence to own stocks.
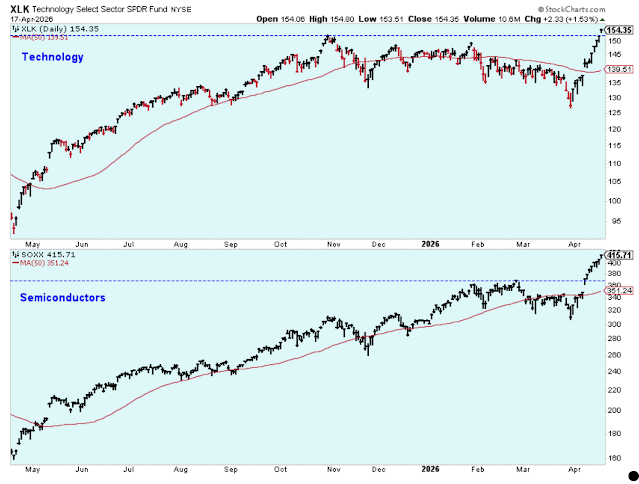
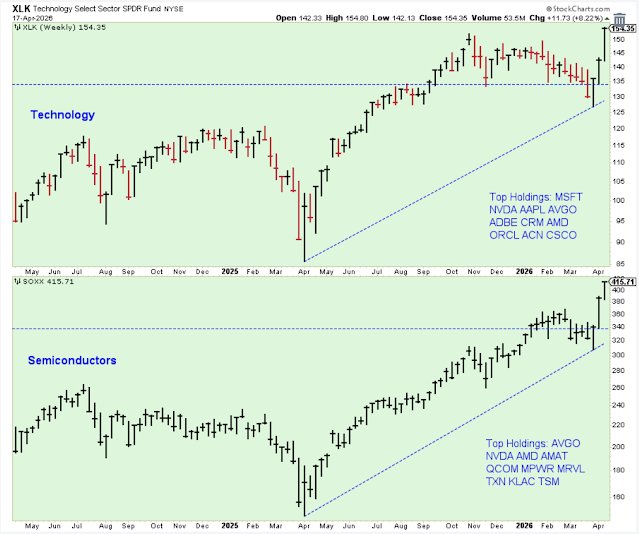
The "technology leadership" indicator is once again bullish, with both of these ETFs hitting price highs. The semiconductor rally has been huge.
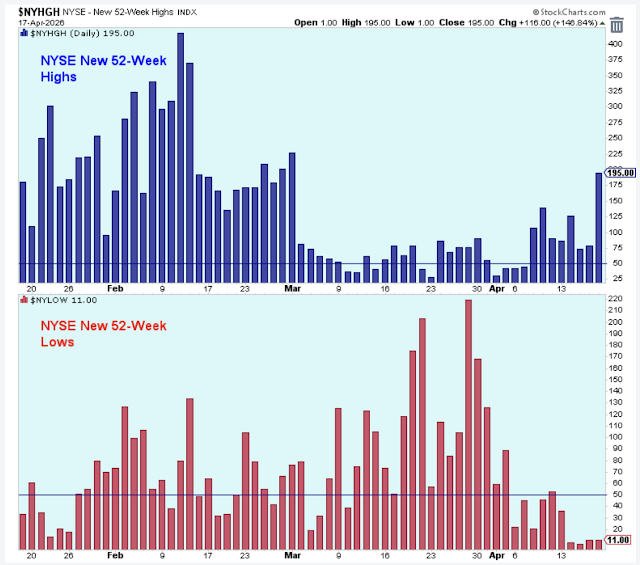
The NYSE 52-week new highs have recovered, while the NYSE 52-week new lows have dropped down to harmless levels.
The charts are generally working in favor of the bulls, except for the fact that stocks have rallied too far and too fast, in my opinion. It doesn't sit right for me, and I will remain cautious for now.
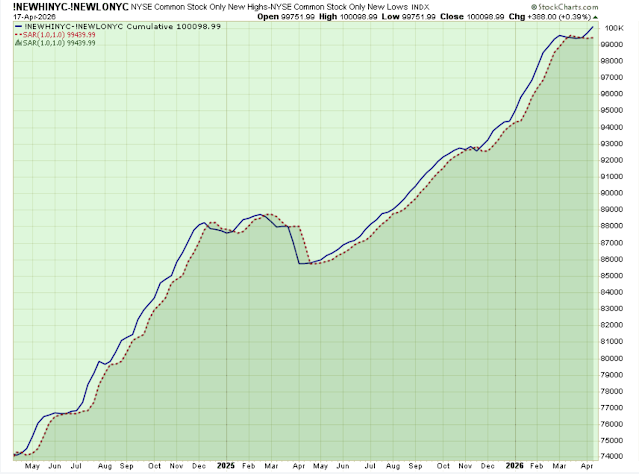
Meanwhile, I was very skeptical of my favorite long-term indicator just few weeks ago, but it did its job quite well. Even though it went negative in March, it wasn't by much and it certainly wasn't suggesting a sell-off similar to the selling seen in the November 2024 to May 2025 time period.
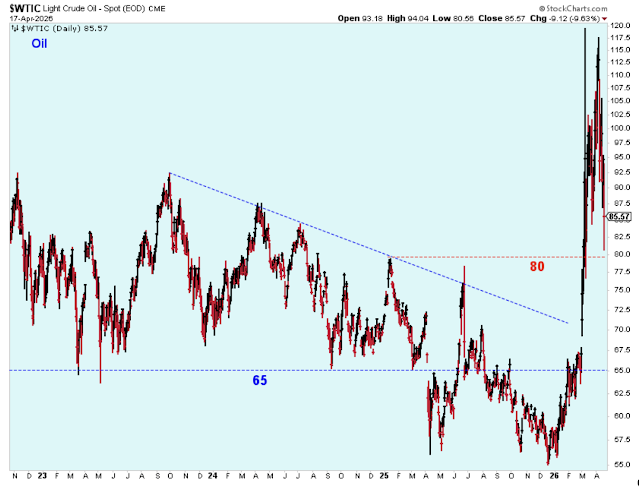
By now everyone is familiar with the gigantic break out in oil prices, but the question is what happens to oil prices from here and how damaging will higher energy prices be to the world economy?
I think the 80-level is about where oil prices will find support, and that seems like a huge difference from where it was a few months ago. I just don't see how it couldn't be very hurtful to the economy and eventually stock prices. But, I perform better in the stock market when I don't predict, which means that I will need to soon get my trading account into sync with the market despite this chart.
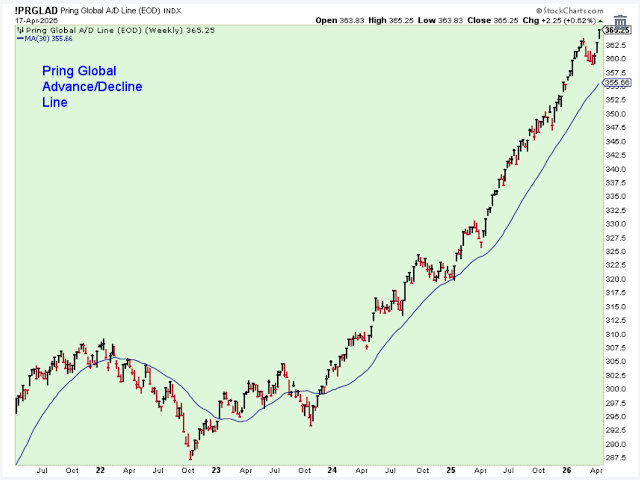
This next chart tells us that it isn't just US stocks hitting new highs. Stock prices around the world are behaving well.
I was also quite skeptical of the small-cap rally, and look where this index is now. This is a bullish indicator.

Consumer stocks look like they are getting ready for new highs.

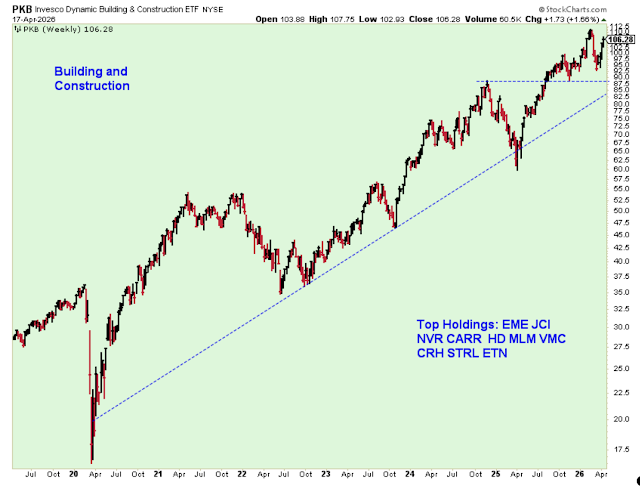
Next is a similar, bullish-looking chart for building and construction industrials.
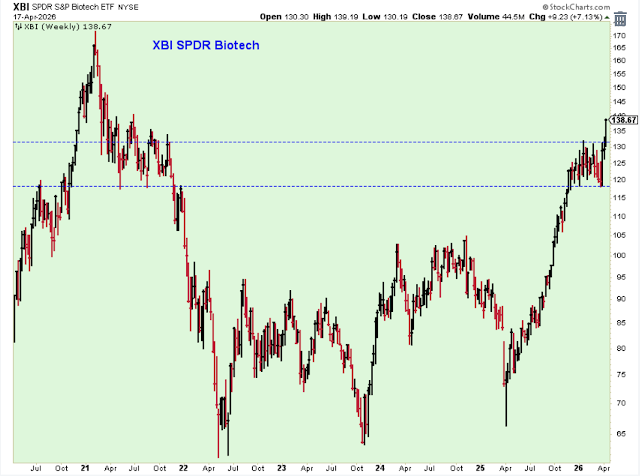
Biotech stocks have been performing well.
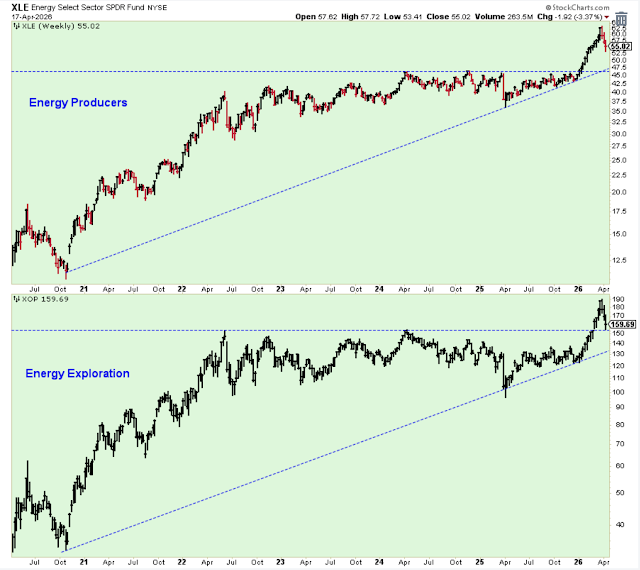
Despite the pullback in these energy ETFs, I still think they should be owned. I'm a buyer on pullbacks, not on break outs.
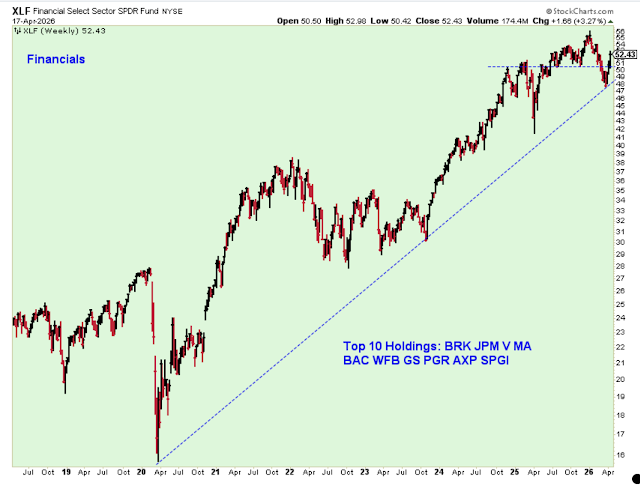
Financials were in ruins a few weeks ago, but they have since recovered well.
Here is another look at the price patterns of the technology ETFs. This chart seems to be another bullish indicator.
Outlook Summary
The medium-term trend is neutral for Treasury bond prices.


Comments
Log in or sign up to join the conversation.