

Image Source: Arturo Añez on Unsplash
The general stock market continues to look good, although it does also appear to be extended and led by a narrowing group of stocks.
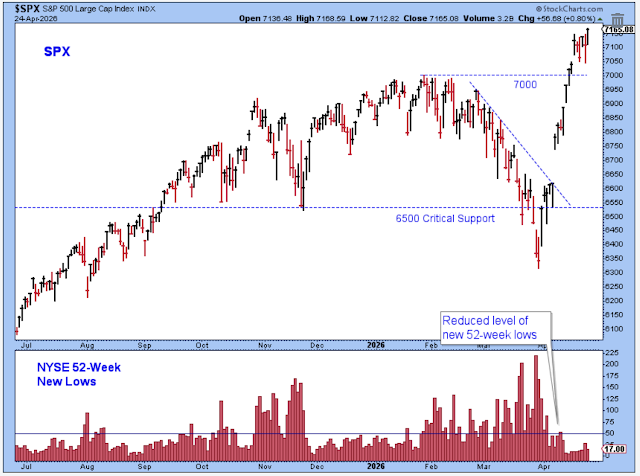
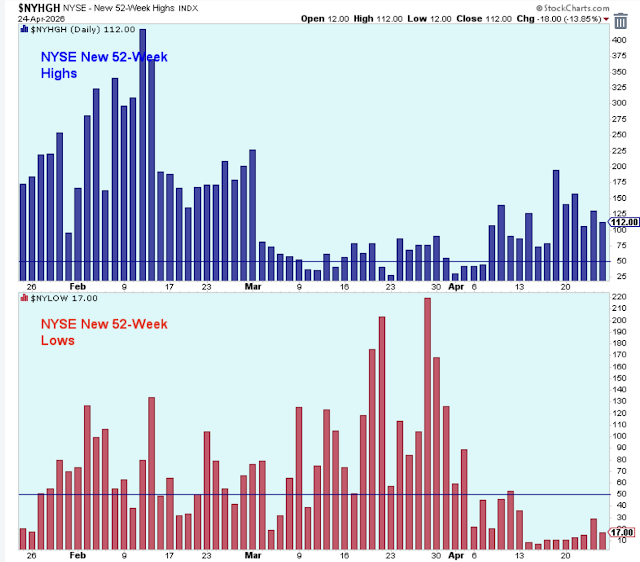
This first chart shows the SPX breaking to a new high and well above the critical breakout level of 7,000, while the number of NYSE new 52-week lows remains at harmless levels.
However, I am still a skeptic regarding this market, although I'll have no choice but to throw in the towel and get bullish before long if prices continue to trade above the 7,000 level.
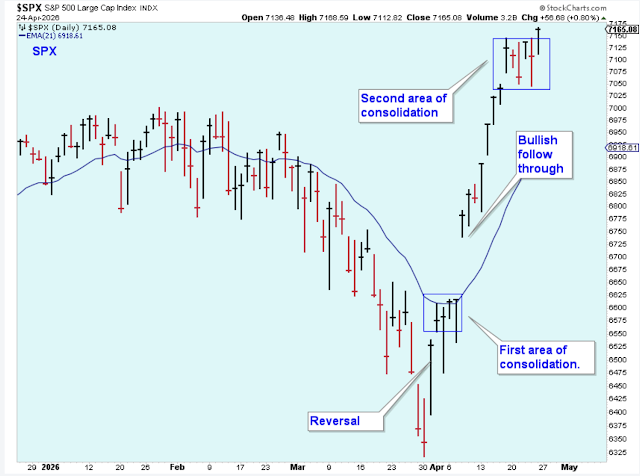
As mentioned, the market certainly looks extended in the short-term. My guess is that we are seeing the final wave of a bullish three-wave price pattern.
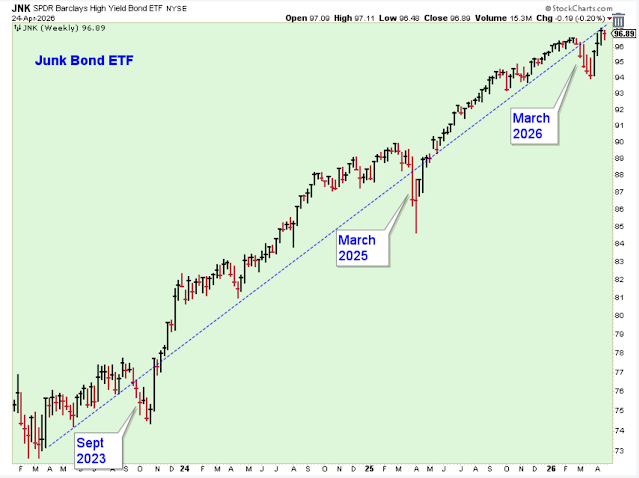
Junk bonds are trading above the early 2026 level, but they haven't broken above the trendline, revealing just a tiny bit of technical weakness. I wouldn't make too much of this yet, though.
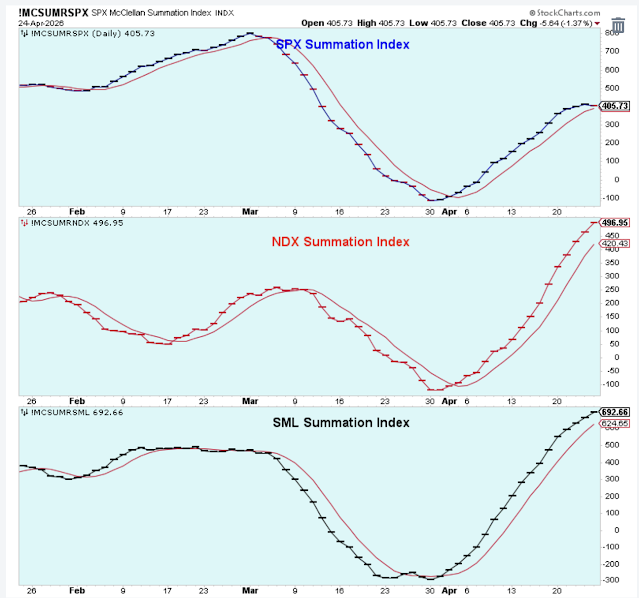
The summations look like they could be ready to roll over -- maybe. The SPX summation is weak and below the March peak, which is a non-confirmation. However, the NDX and SML summations look quite healthy, and they are confirming the price breakouts for both indexes.
The number of NYSE new 52-week lows, as discussed earlier, is at harmless levels, and that is certainly a market positive. However, the number of new highs isn't very convincing, being well below where it should be while the indexes hit new price highs. This is another sign of weakness for the general market.
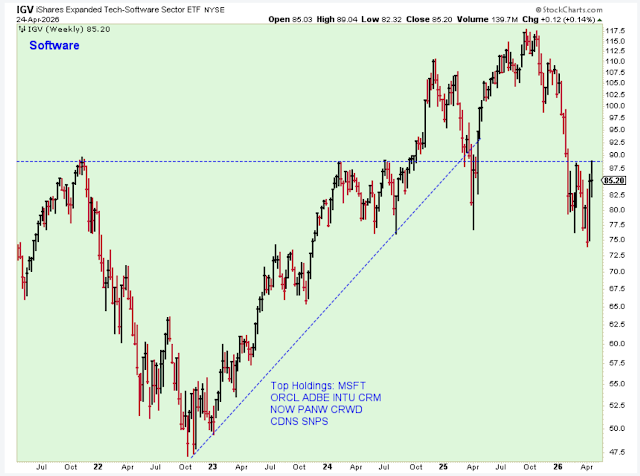
On CNBC, the panel of investors seemingly can't stop talking about the bounce off the lows for this ETF of software stocks. They view the recent price action as quite positive for stocks in general.
What? I'm thinking that this very important group of former leaders looks rather weak, trapped under major long-term resistance.
Investors.com continues to recommend that between 80%-100% of your accounts be invested in stocks. My view is far less optimistic, and I am about 40% invested. I've taken profits on most of my recent purchases of technology stocks.
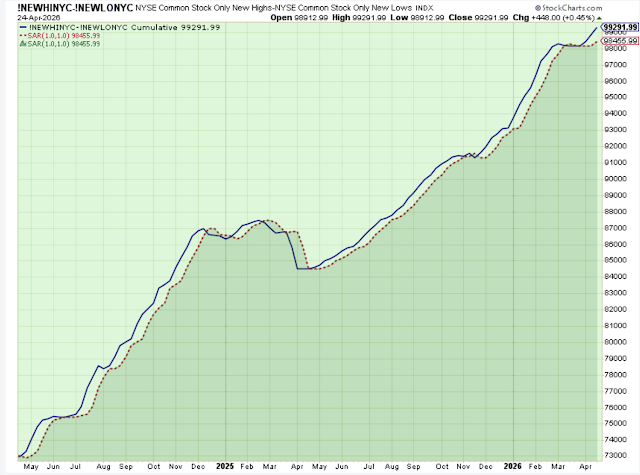
Meanwhile, the longer-term market indicator continues to point higher. As mentioned earlier, I need to get in sync with the direction of the market and my own indicators. However, I'm just not ready yet.
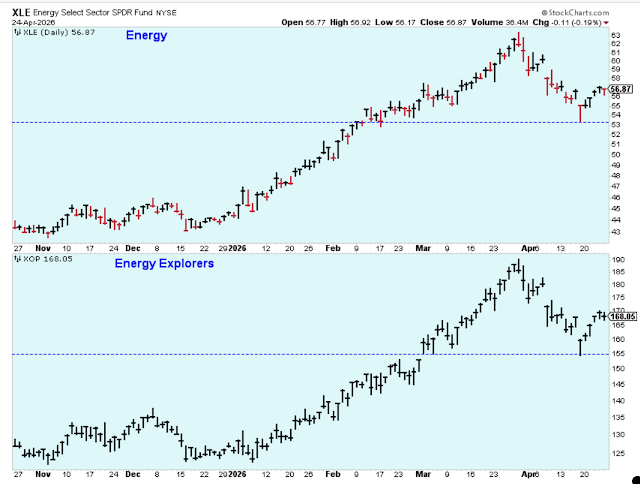
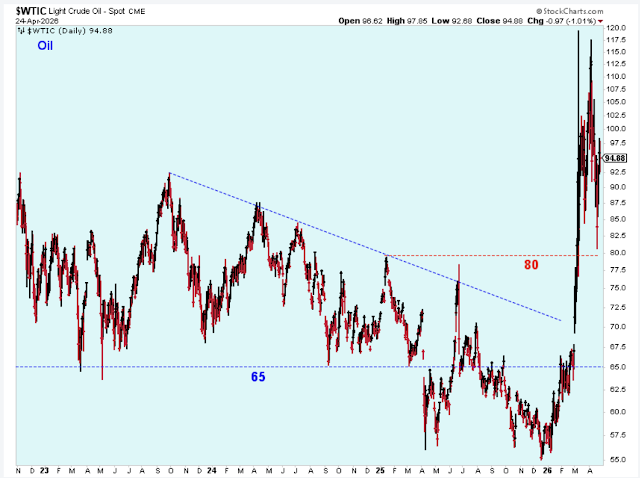
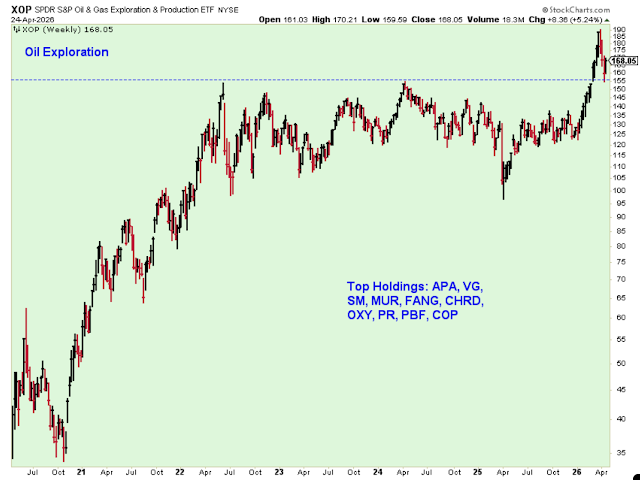
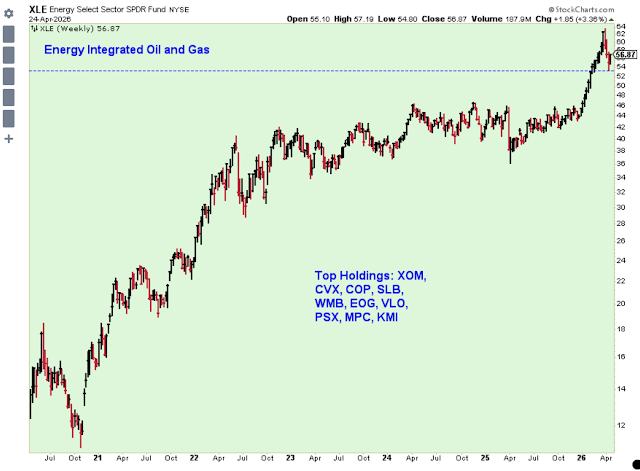
While I am skeptical of most stocks at the moment, particularly technology, I do want to own energy stocks. I'll be a buyer as long as these ETFs trade above their short-term support levels. More on that below.
The price of oil moved up too far and fast for it not to be a major drag on the world economy, and therefore, on stock prices. The question is, however, how long will it take for higher oil prices to start to impact the economy to the point where stocks are getting hurt?
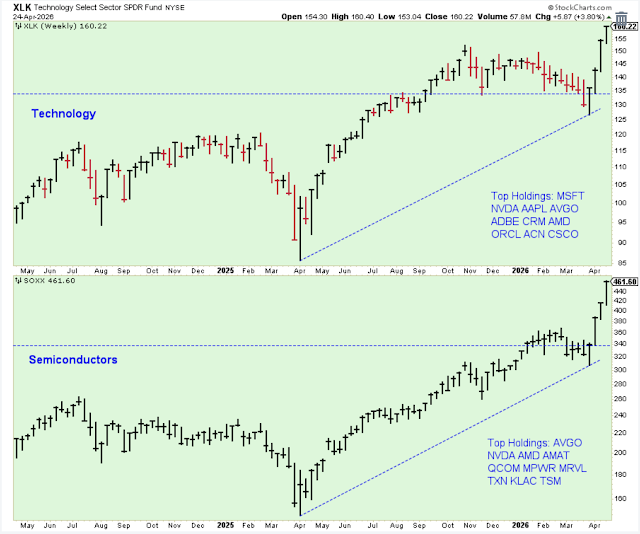
This chart is another look at the technology ETFs and the phenomenal move they have made over four weeks. Even if you are bullish on this market overall, you must know that there is a pullback coming for these stocks.
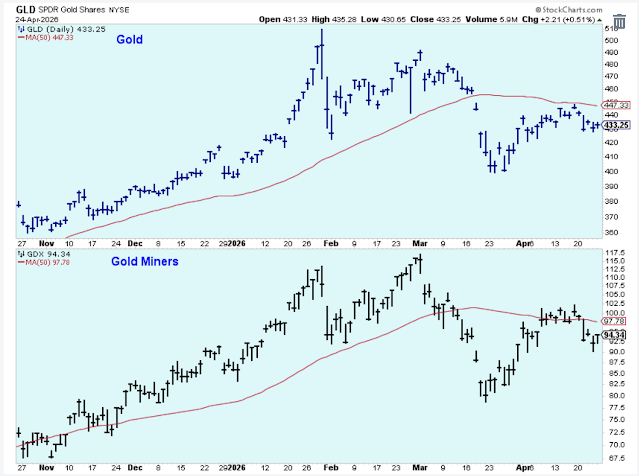
Gold and gold miners are not participating in the bullish stock market run. Both of these ETFs are below their 50-day lines. As long as the ETFs are struggling, I'm staying away from the individual stocks.
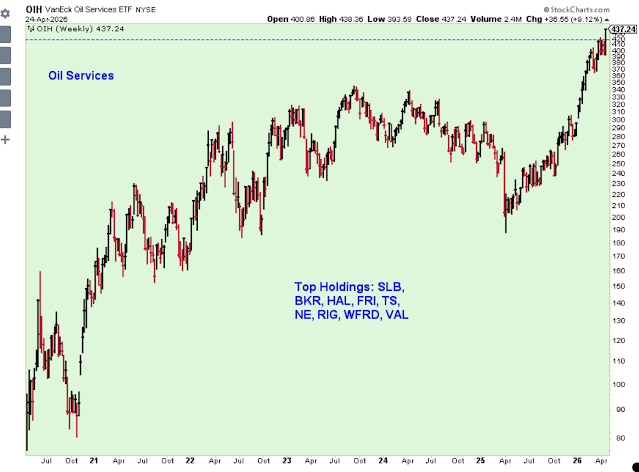
Oil service stocks have taken off higher. This is where my attention lies at the moment.
Oil explorers haven't moved as much as I would have thought, but I still like these stocks. Although it may take longer for them to participate.
The integrated oil stocks moved up before the Iran war, and they now have retraced the gains by a bit. I like the look of these stocks here.
Outlook Summary
The medium-term trend is neutral for Treasury bond prices.


Comments
Log in or sign up to join the conversation.