

Image Source: AbsolutVision on Unsplash
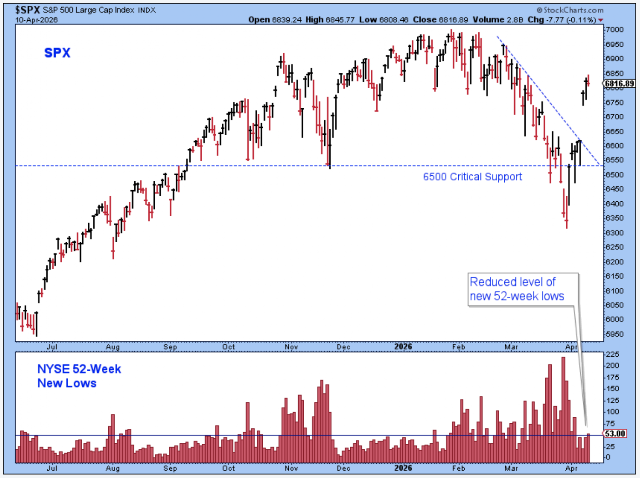
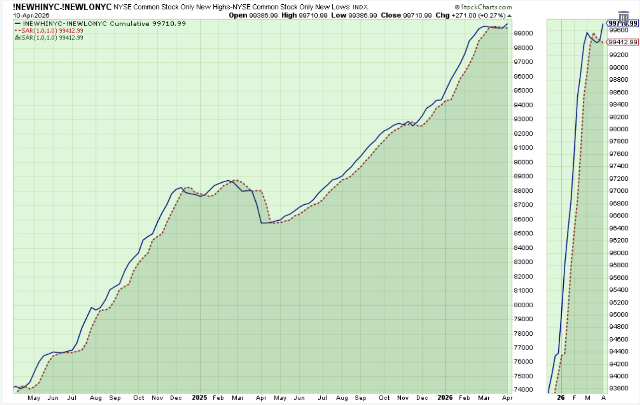
On Wednesday, April 8, the market gapped up and broke out, and, in the process, shifted the market into an uptrend. At the same time, the number of NYSE new 52-week lows dropped down to harmless levels.
Now what? We must watch the new support levels, such as the session low of April 8. If the market trades below this level, we will re-enter a period of increased caution.
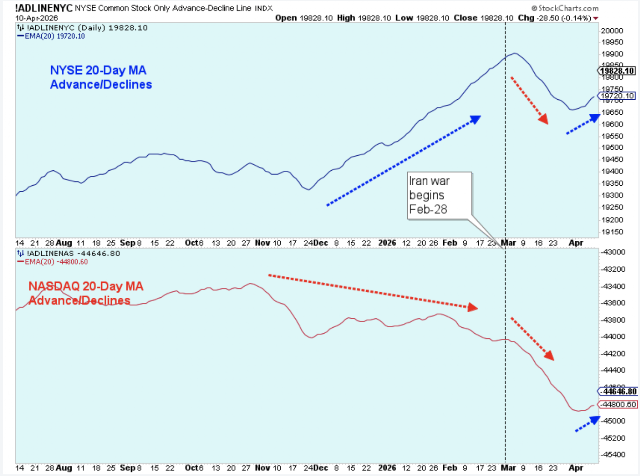
The trend of these 20-day moving averages of advance/declines helps us define the trend, particularly if the two exchanges are pointing in the same direction. This chart shows a short-term uptrend.
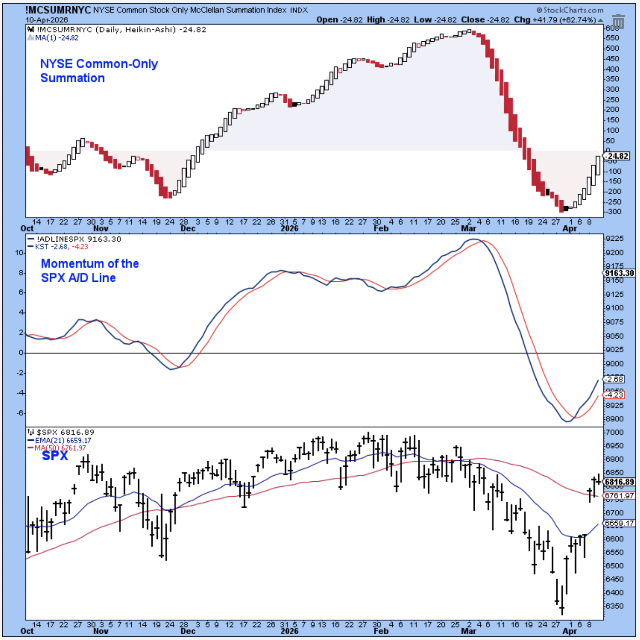
Here is another chart which allows us to see that the short-term trend is up.
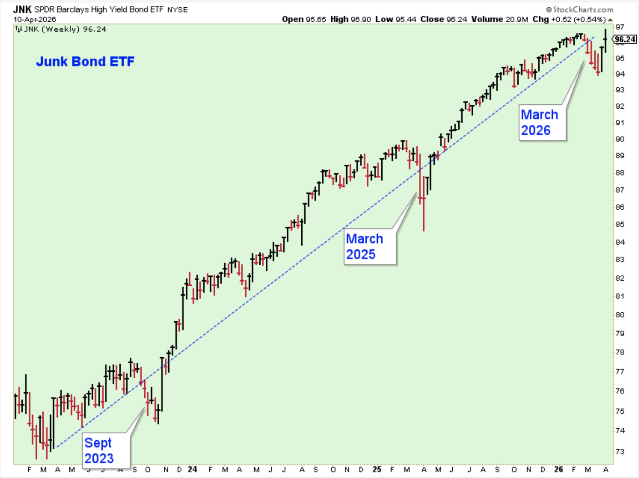
This next chart helps us by confirming that the price of junk bonds is moving in the same direction as the price of stocks. This ETF has bounced upwards nicely but closed the week in the middle of the range, leaving some doubt about how long the short-term uptrend will last.
This is the chart I use to help me determine the longer-term trend of the market, and, as you can see, it issued a rather convincing-looking uptrend signal last week.
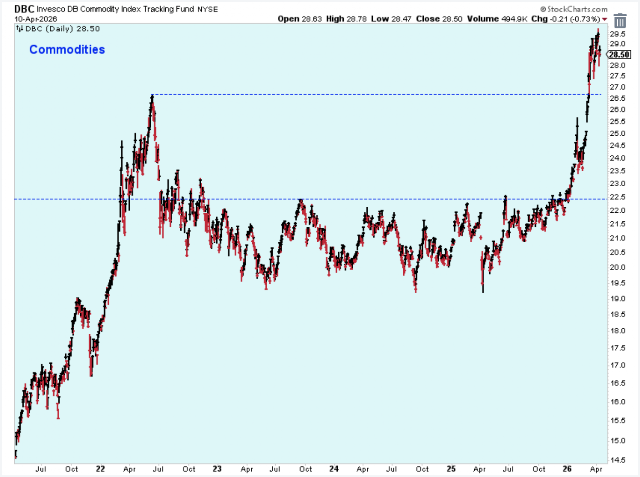
If you are worried, like I am, that the price of commodities is going to eventually undermine the stock market, then this next chart won't make you feel better. This is a really convincing breakout of a multi-year base price pattern. Rising commodity prices lead to higher inflation, and therefore higher yields and rates, which push down stock market multiples, particularly damaging the prices of high multiple stocks, such as technology.
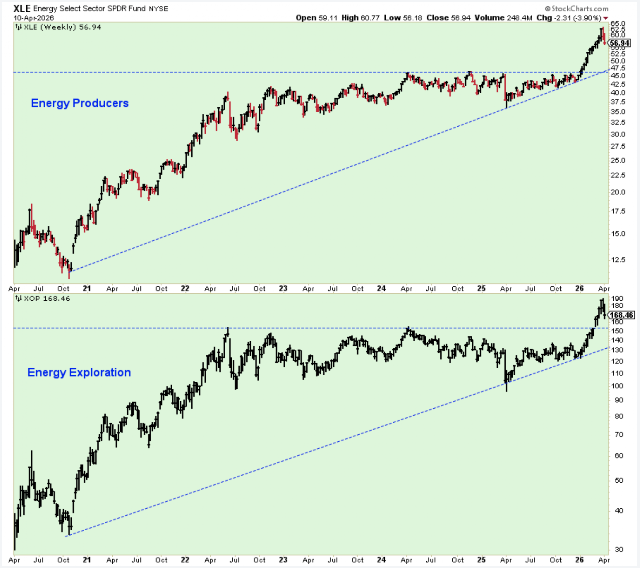
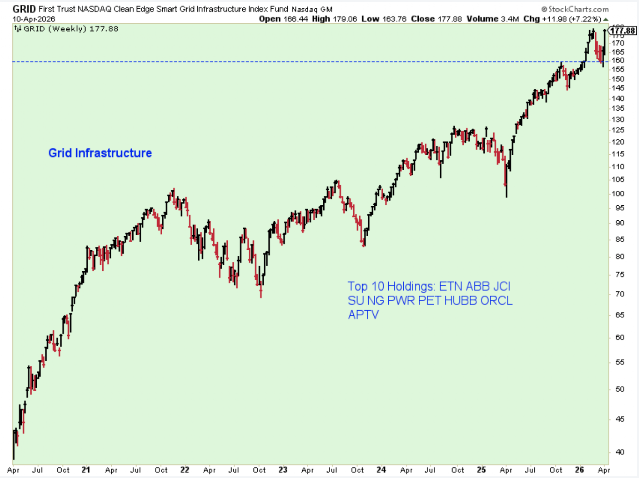
Energy-related stocks have pulled back a bit in the past week, but before that, they broke out beautifully. These two charts tell me that energy stocks should be owned, but perhaps bought on pullbacks.
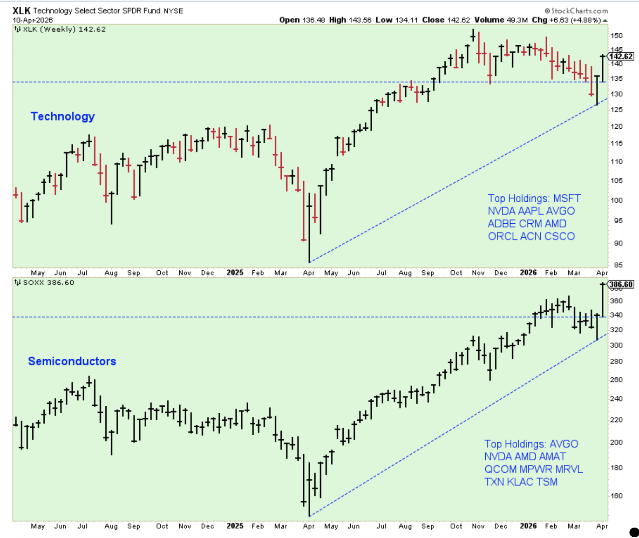
Technology and Semiconductors need to be the bull market leaders, in my opinion, and the trend reversal shown over the last two weeks has been encouraging.
Other areas of the market responded quite well this past week. This ETF is close to an all-time high.
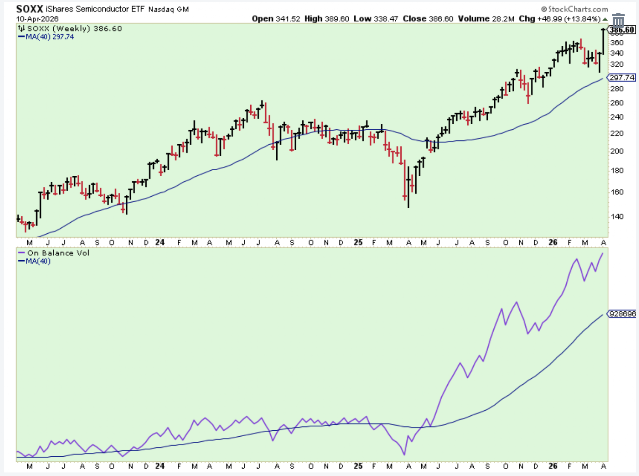
Here is another look at the semiconductors, but this time the chart shows how strong the associated on-balance volume has been for this ETF. You can barely see any selling pressure in the lower panel.
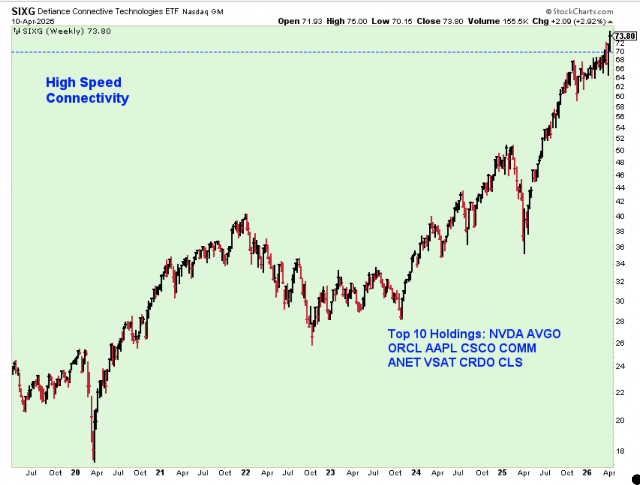
Next, another ETF appears to be hitting all-time highs.
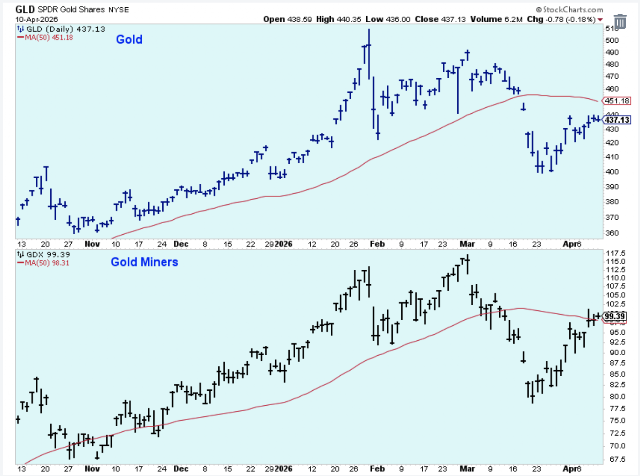
I'm not yet enthusiastic about the gold mining stocks because the gold metal ETF is still well under its 50-day moving average.
Outlook Summary
The medium-term trend is neutral for Treasury bond prices.


Comments
Log in or sign up to join the conversation.