


The global economy runs on energy. It is the master resource, the foundational input upon which every other economic activity depends. Yet, for the better part of a decade, financial markets have treated oil as an afterthought, preferring the digital illusions of technology, software as a service, and artificial intelligence over the physical realities of molecules, steel, and infrastructure. The great illusion of the 21st century is that our world runs on code. In reality, it runs on physical geology—highly refined, deeply excavated chunks of the earth's crust. Today, that financialization of the economy is colliding head-on with a historic physical shortage.
The world’s oil market is currently buckling under simultaneous, compounding stress across every measurable dimension: supply, refining, logistics, and geopolitics. Our strategic buffers are completely drained, diplomatic peace frameworks have evaporated, and multiple military fronts are actively targeting vital energy infrastructure. We are not just looking at a cyclically tight market; we are witnessing a structural dislocation of a magnitude not seen since the 1970s. What follows is a comprehensive, multi-dimensional account of how the market arrived here, the stark reality of the physical deficit, and the macroeconomic reckoning that lies ahead for financial markets.
Part I: The Supply Shock – Barrels That Never Shipped
When the US-Iran conflict escalated into direct warfare in late February 2026, it triggered the most severe supply disruption in modern oil market history. Wall Street analysts completely underestimated the fragility of the maritime chokepoints. Commercial shipping traffic through the Strait of Hormuz—the narrow waterway through which roughly 20% of the world's oil passes—fell to a trickle in March 2026. The International Energy Agency (IEA) estimated an 8 million barrel-per-day (bpd) reduction in global oil supply that month alone.
The cascading numbers that followed laid bare the market's vulnerability. According to S&P Global, global oil supply plummeted by approximately 10 million bpd in March, with a similar rate of loss sustaining through April, as Gulf countries were forced to shut in wells and restrict tanker loading. Commercial inventories outside the Gulf were violently drawn down by over 200 million barrels in the first months of the conflict—with 85 million barrels vanishing from global storage in March alone. Middle East exports, which had been running at roughly 23 million bpd before the war, collapsed to between 10 and 16 million bpd. This represented an instantaneous reduction of 20% to 50% of regional export capacity.
Even when a brief, highly publicized political ceasefire arrived in June, it left approximately 10 million bpd of Gulf oil exports trapped. The physical infrastructure for loading and shipping had been disrupted beyond what a political memorandum of understanding could immediately repair. By late September, Goldman Sachs estimated that approximately 23 million bpd were leaving the Middle East—broadly consistent with pre-war averages, suggesting a partial normalization of Hormuz flows. But this normalization is a mirage, masking the fact that the Bab el-Mandeb strait and the Red Sea route remain severely disrupted, locking the global supply chain in a permanent state of duress.
Part II: Draining the Buffer and Sovereign Reserve Distortions
Faced with this unprecedented physical shortage, Western governments responded with political expediency rather than structural solutions: they opened their emergency reserves at an unprecedented scale to mask the pain at the pump.
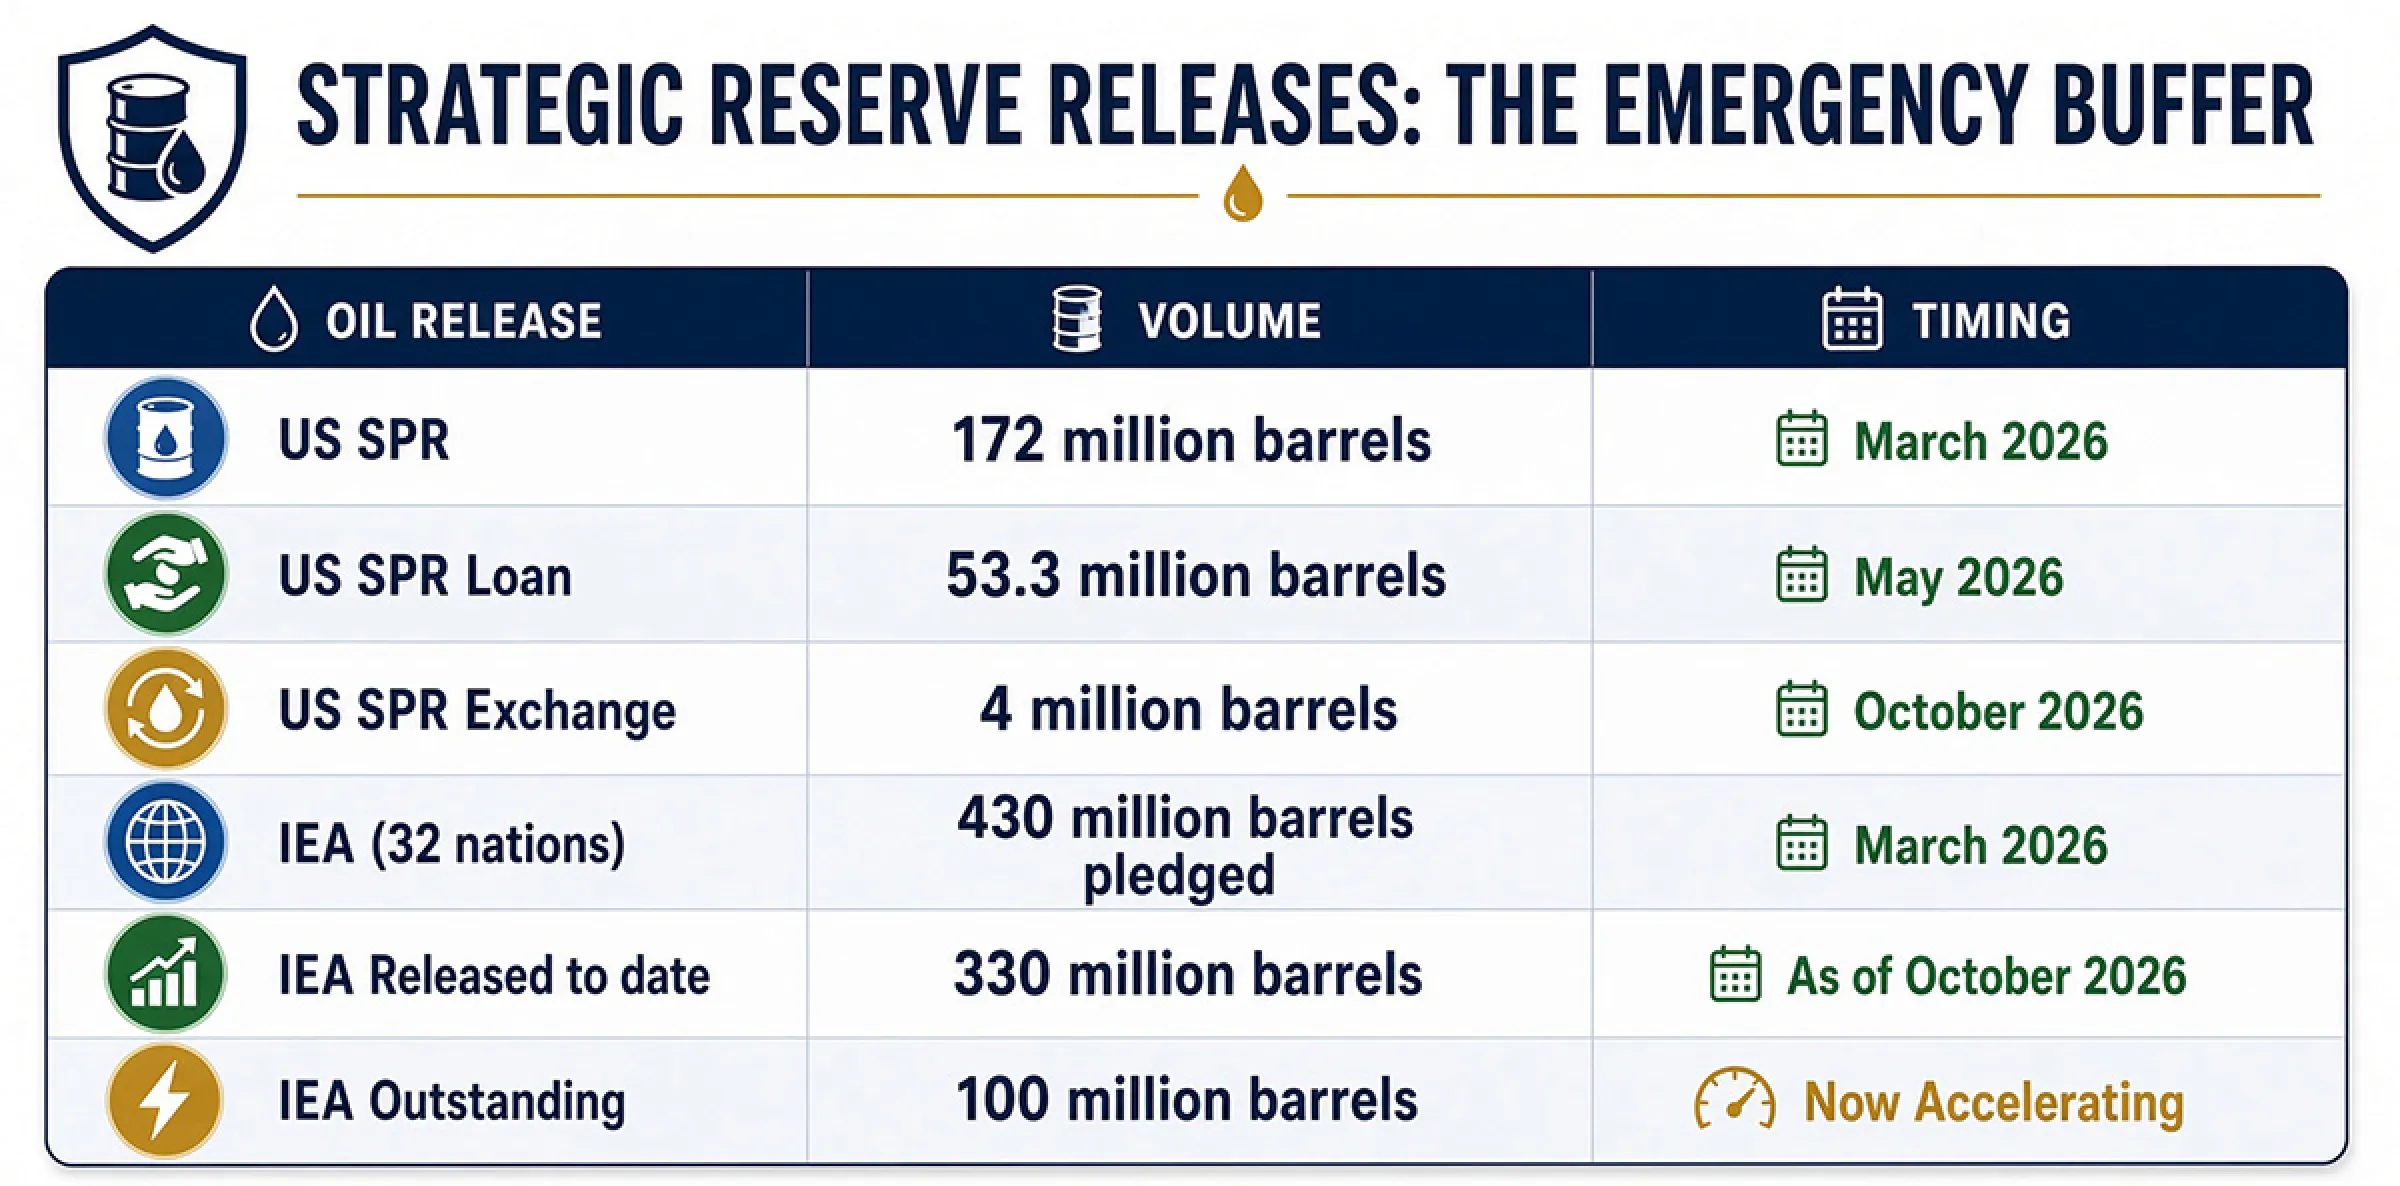
Per Energy Factbook, the US released 172 million barrels from the Strategic Petroleum Reserve (SPR) as part of a coordinated IEA action in March 2026. This was followed by a further 53.3 million barrel loan in May, and an exchange of up to 4 million barrels in October to address hurricane-related disruptions. Globally, across 32 allied nations, the IEA pledged a total of 430 million barrels. Of that, 330 million barrels have been released to date. The remaining 100 million barrels are now being accelerated—the IEA agreed just this morning to release them as quickly as possible, including a desperate injection of more than 20 million barrels of diesel.
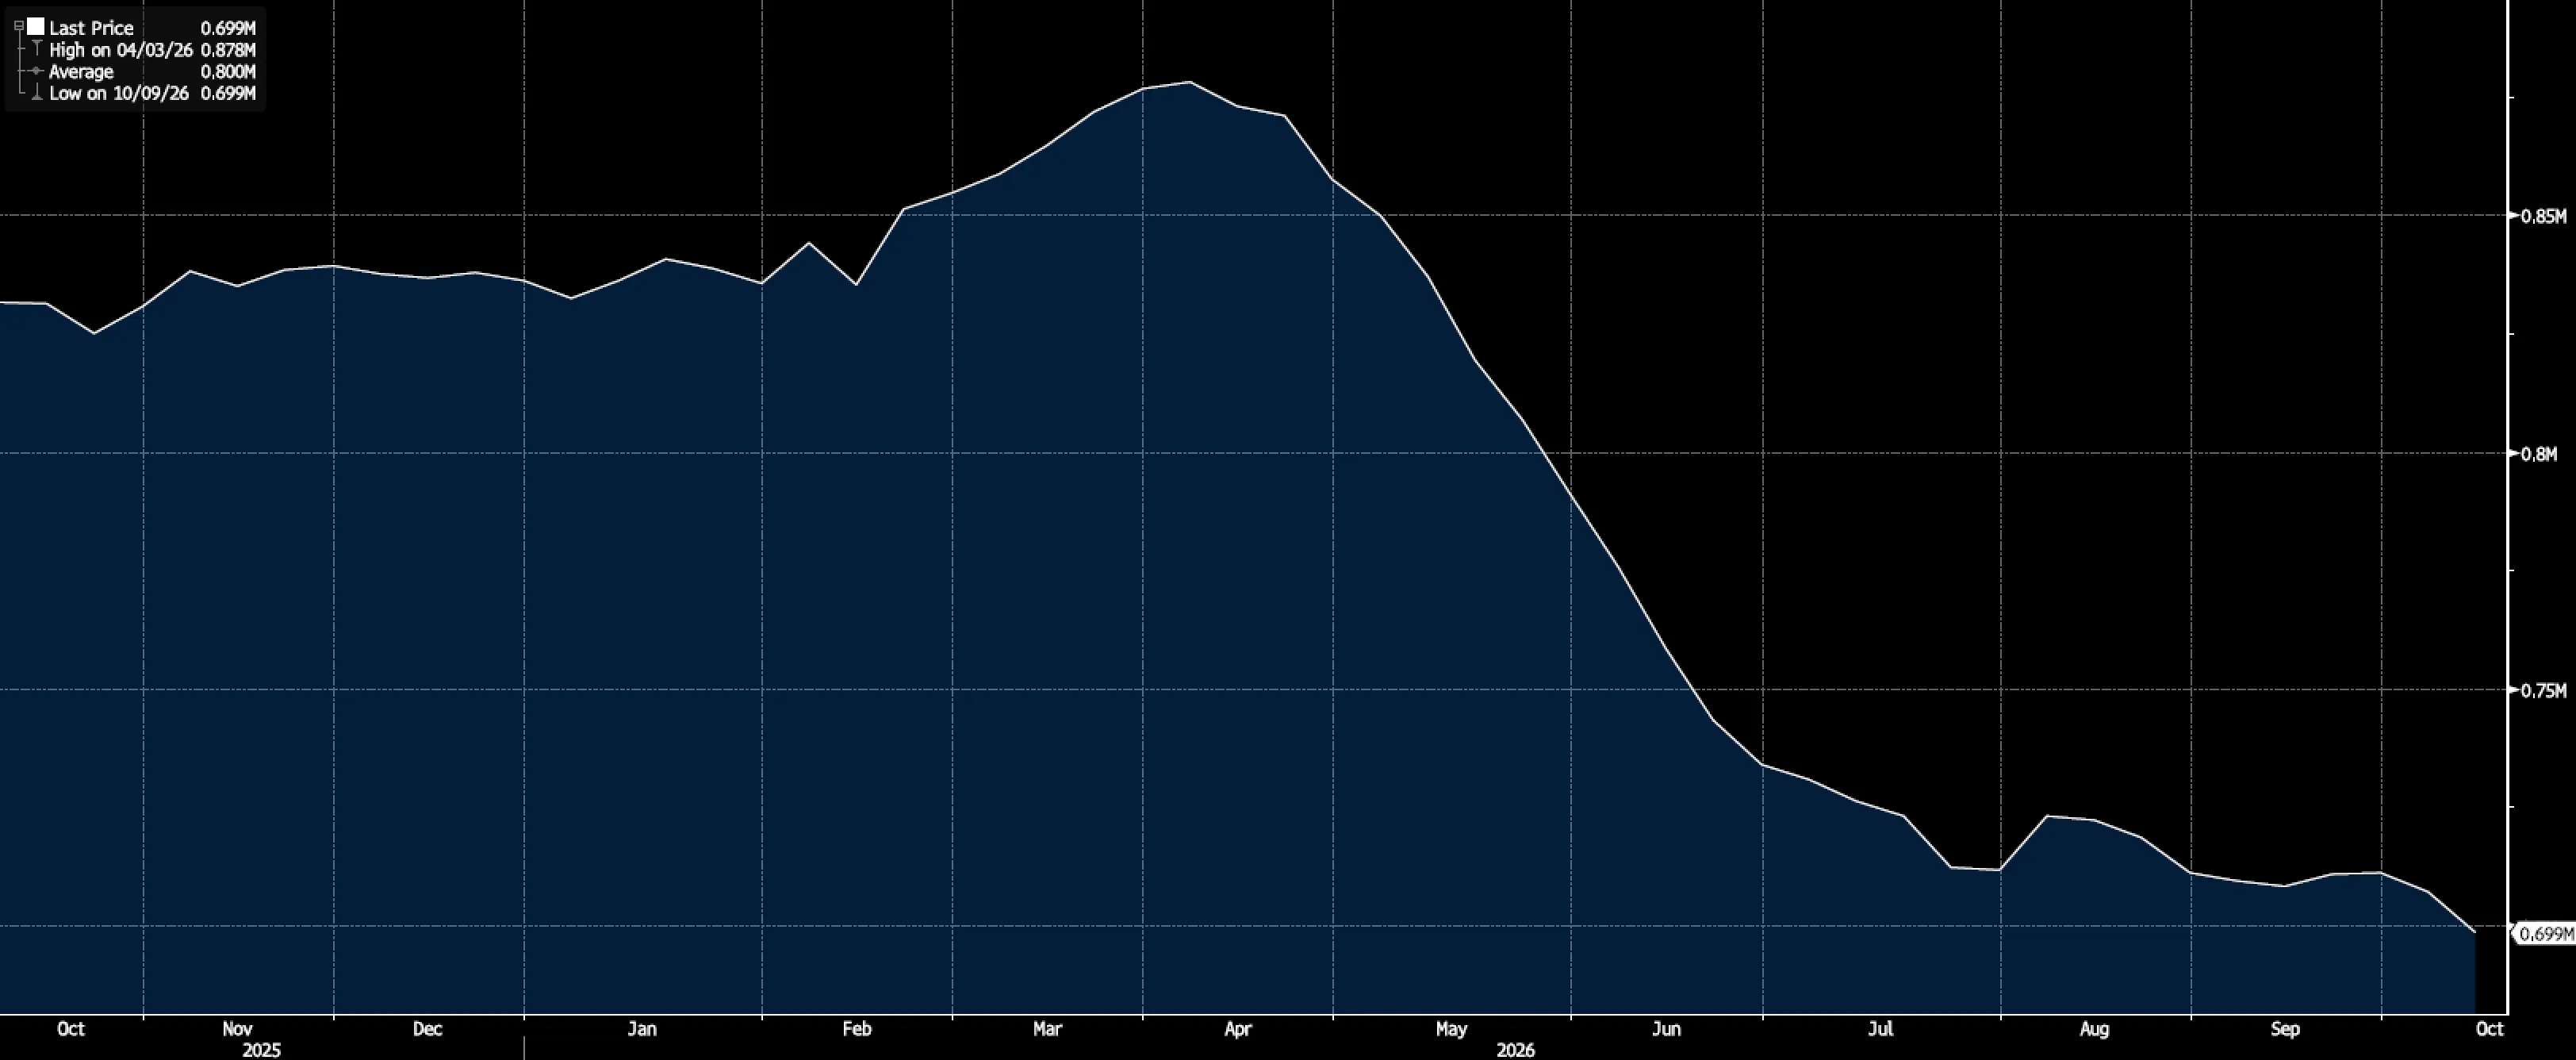
The long-term cost of this intervention is catastrophic. The US SPR now sits near its lowest level since 1982. Energy Secretary Chris Wright indicated as recently as July that another major withdrawal was not planned, citing the desperate need to preserve what little buffer remains. President Trump, who pledged at his January 2025 inauguration to fill the reserve "right to the top," now presides over a reserve that is structurally depleted at precisely the moment when geopolitical risk is violently re-escalating.
US Crude Oil Inventories
J.P. Morgan and the Anatomy of Phantom Inventories
This massive government intervention has created a dangerous, self-defeating optical illusion in the market. As J.P. Morgan accurately diagnosed in their recent, highly critical analysis titled "The Anatomy of Phantom Inventories," Wall Street’s pricing models have been completely blinded by sovereign reserve distortions.
For the past year, financial markets have conflated sovereign reserve liquidations with actual structural supply. Releasing barrels from the SPR does not create new production; it merely pulls forward future physical deficits to manufacture a temporary political reality. By dumping sovereign reserves into the commercial market, governments artificially suppressed the vital price signals necessary to balance the market.
This distortion has kept commercial inventories looking deceptively robust on paper, hiding the underlying structural deficit. More importantly, it has actively discouraged the long-term upstream capital expenditures desperately needed to replace declining legacy fields—adding to an upstream capex deficit that has grown to roughly $3.5 trillion since 2014. The market is currently balancing its books using phantom barrels that are rapidly vanishing. We are burning our seed corn to keep the financial markets warm.
The Replenishment Wave: Demand That Has Yet to Come
The depletion of strategic reserves does not end the story—it begins a massive new chapter. Every single barrel released from the SPR and IEA reserves must eventually be replenished. Companies that received SPR loans are legally required to return that oil by 2029. The US SPR alone has a gap of potentially 300-400 million barrels or more from its 727-million-barrel capacity (see SPR Quick Facts | Department of Energy).
The Energy Information Administration (EIA) projects it will take until Q2 2027 for most global trade flows to return to pre-conflict averages. When that restocking begins in earnest, it will drive a massive, price-inelastic surge in demand. Governments will be forced to compete with commercial refiners for scarce barrels, placing an immovable floor under crude prices and keeping shipping rates elevated well into the recovery phase.
Part III: Refineries at the Breaking Point
You cannot run a global economy merely by pulling crude out of the ground; it must be refined into the diesel, jet fuel, and gasoline that powers modern civilization. Today, the global refining system is fundamentally broken.
Reuters’ reported October 7 that US refineries are operating at a grueling 92.7% utilization rate—near the maximum sustainable rate—running equipment hard with deferred maintenance. Yet, US distillate inventories are approximately 12% below the five-year average and near the lowest levels for this time of year in decades, according to the EIA.
Overseas, the situation is dire. More than 3 million bpd of Middle Eastern refining capacity has been shut down or made unavailable, removing precisely the complex facilities configured to process heavier crude grades and maximize middle distillate yields. Russia has added another severe layer of disruption. Ukrainian drone strikes have taken approximately 30-35% of Russian refining capacity offline as of mid-July 2026, producing the lowest domestic refinery processing levels since 2005, according to Bloomberg. The shortage is so acute that Russia has extended its restrictions on diesel and gasoline exports through January 31, 2027. China, meanwhile, saw refinery activity decline by nearly 16% year-over-year in July, effectively eliminating its role as a swing supplier of refined products to Asian markets.
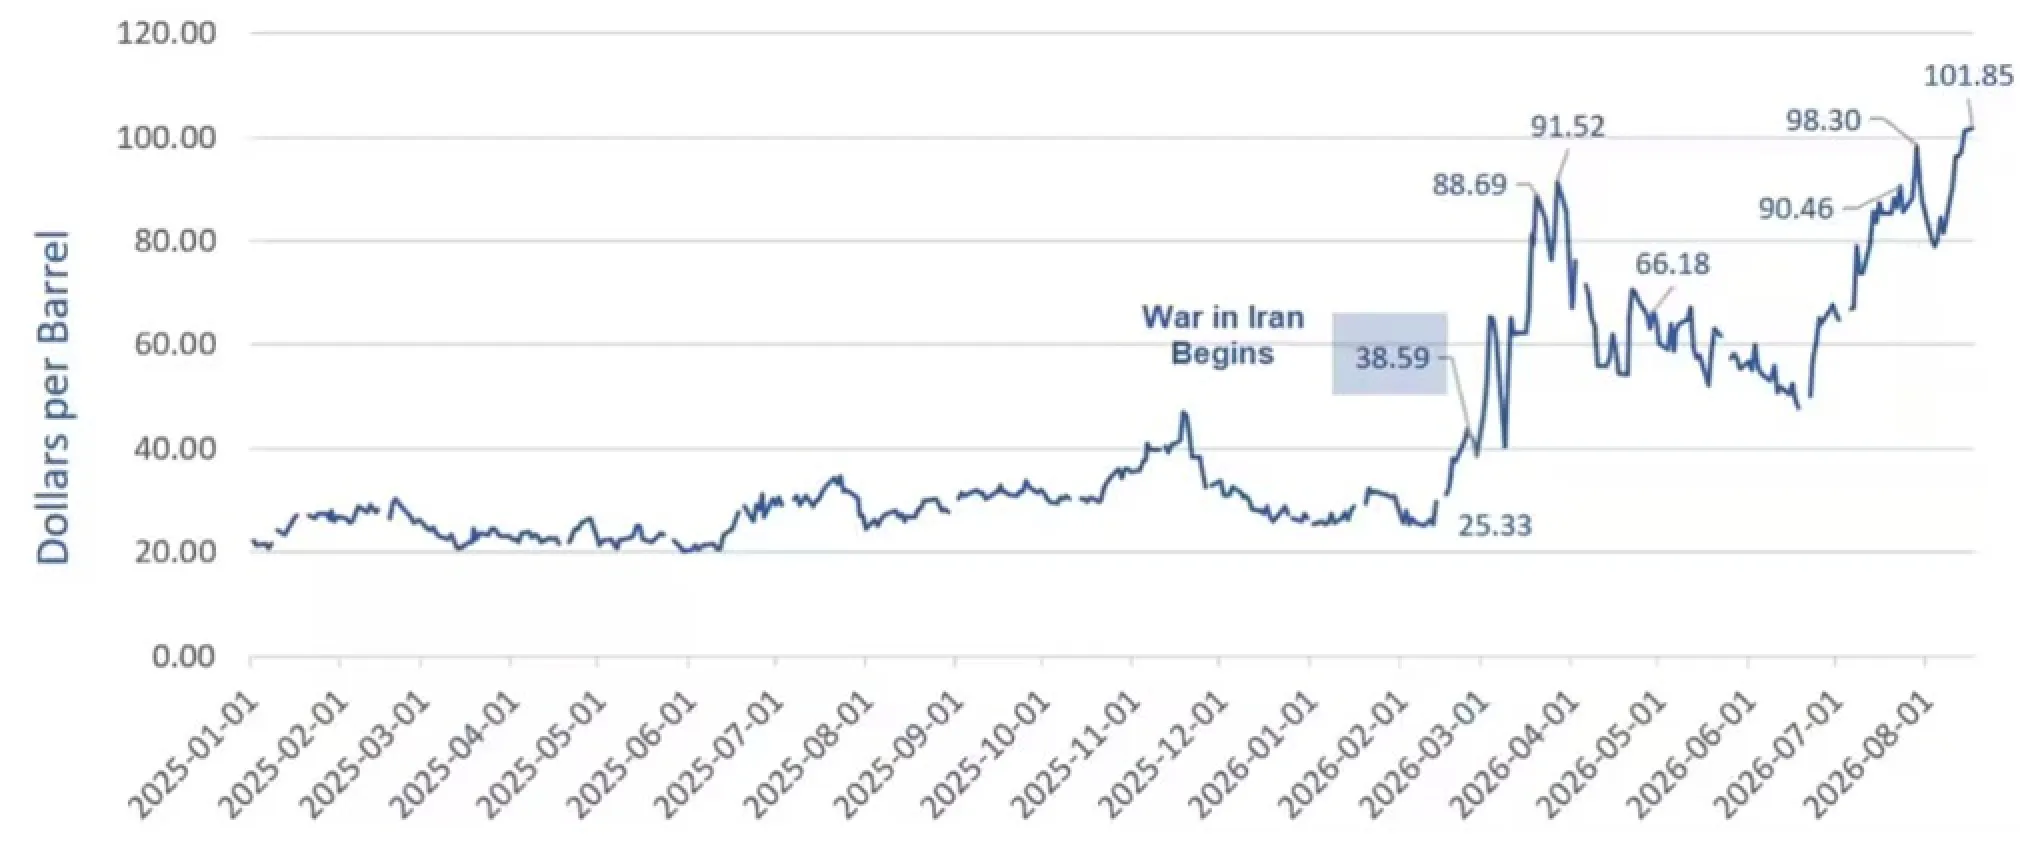
The result is a historic squeeze in the real economy. The US diesel crack spread—the actual profit margin refiners earn converting crude into the diesel that powers global trucking, agriculture, and rail—surpassed $100 per barrel for the first time in history, reaching a record $102.2/bbl. The feedback loop is self-reinforcing: each additional refinery outage or shipping delay carries a massively asymmetric impact when spare capacity is exhausted and inventories are depleted.
Diesel Crack Spreads
Part IV: The Tanker Crisis and the Cost of Money
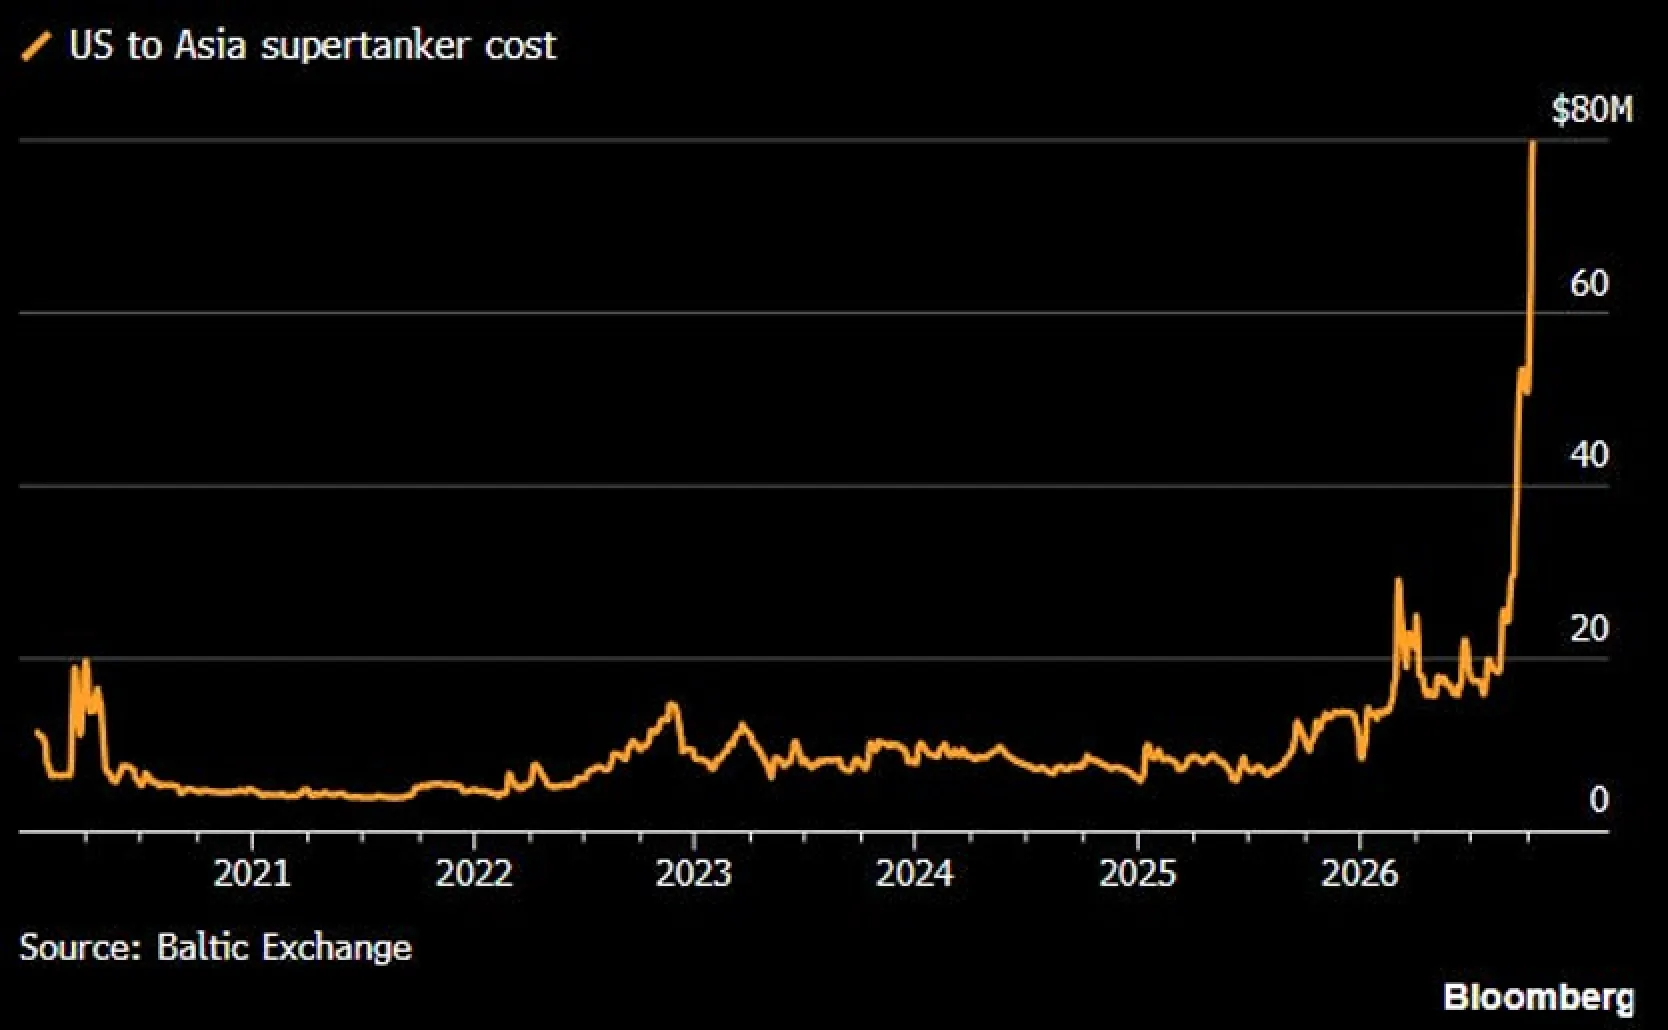
The global shipping fleet is paralyzed, and the tanker market has experienced one of the most dramatic rate surges in maritime history. According to Signal Maritime, the Baltic Dirty Tanker Index, which tracks the cost of shipping crude oil and other “dirty” petroleum cargoes, stands at 7,922 on the day this is being written—up a staggering 76% in a single month. Average global crude vessel earnings surpassed $500,000 per day in early October, approximately ten times the 2025 average. Very Large Crude Carrier (VLCC) rates have surged 583% since July 24, with industry projections pointing to $700,000 to $1,000,000 per day by late October.
The route disruptions driving these numbers are severe. Reuters notes that the Yanbu-to-Taiwan tanker route now takes 48 days versus 19 days before the war, as ships are forced to reroute via slow ship-to-ship transfers off Fujairah-Sohar. Rerouting around the Cape of Good Hope adds 10 to 20 days per voyage, absorbing effective fleet capacity that cannot be quickly replaced. War risk insurance premiums have skyrocketed, and shipowners face a fragmented fuel market with an inability to refuel at familiar ports when forced on these longer journeys.
The structural backdrop makes this vastly worse. As Bloomberg Intelligence analyst Kenneth Loh notes, the tanker market was already facing a severe capacity shortage when the conflict erupted—the result of a record-low orderbook in 2022–23 and the diversion of older vessels to Russia's shadow fleet. There is no quick fix. New tankers take years to build.
Peter Boockvar on Supertanker Freight and the Inflationary Tax
As macroeconomic analyst Peter Boockvar recently highlighted, you can see this dislocation vividly in the cost of chartering a VLCC supertanker to move crude from the US to Asia. The astronomical explosion in freight costs acts as a massive, unlegislated inflationary tax on the global supply chain before the oil even reaches a refinery.
This brings us to a critical macro collision. Boockvar consistently warns that we are facing a brutal repricing regarding the "cost of money." When a physical energy shock drives sticky, structural inflation—compounded by soaring logistical costs like those US-to-Asia shipping routes—central banks are completely trapped. They lose their ability to print their way out of the next crisis. Tightening policy to fight commodity-driven inflation risks accelerating a recession, while loosening policy risks entrenching inflation further and waking up the bond vigilantes.
Part V: The Second Front and the Peace Delusion
The conflict has now dangerously metastasized. The Houthi expansion of the war into Saudi Arabia represents a qualitatively new risk dimension—a second chokepoint operating simultaneously with Hormuz.
Since the beginning of October, Houthi forces have targeted Riyadh's King Khalid International Airport 20 times, killing 17 and injuring 333, reported the Arab Times. Airports in Abha, Najran, Jazan, and Dammam have also been struck. Even more critically, Houthi attacks on Saudi Arabia's East-West pipeline have caused oil prices to surge. This vital pipeline supplies approximately 4 to 5 million bpd of oil exports through the Red Sea. On October 13–14, Houthi forces struck Saudi Aramco's headquarters in Dhahran directly.
If shipowners abandon the Red Sea route entirely due to skyrocketing war-risk insurance premiums, tanker traffic there could mirror the 97% collapse seen in the Strait of Hormuz at peak disruption. The EU is currently pressing member states to redirect naval assets pledged for a Hormuz mission to the Red Sea instead, with EU diplomat Kaja Kallas stating this week that "the need is bigger than it's ever been." If further military escalation damages energy infrastructure beyond the base case, energy prices could significantly exceed J.P. Morgan’s Q4 2026 Brent base case forecast of $107/bbl, which we have now surpassed as of this writing.
The Peace Question: A Diplomatic Mirage
The diplomatic timeline over the last year reveals a pattern of profound delusion: near-resolution followed by total collapse.
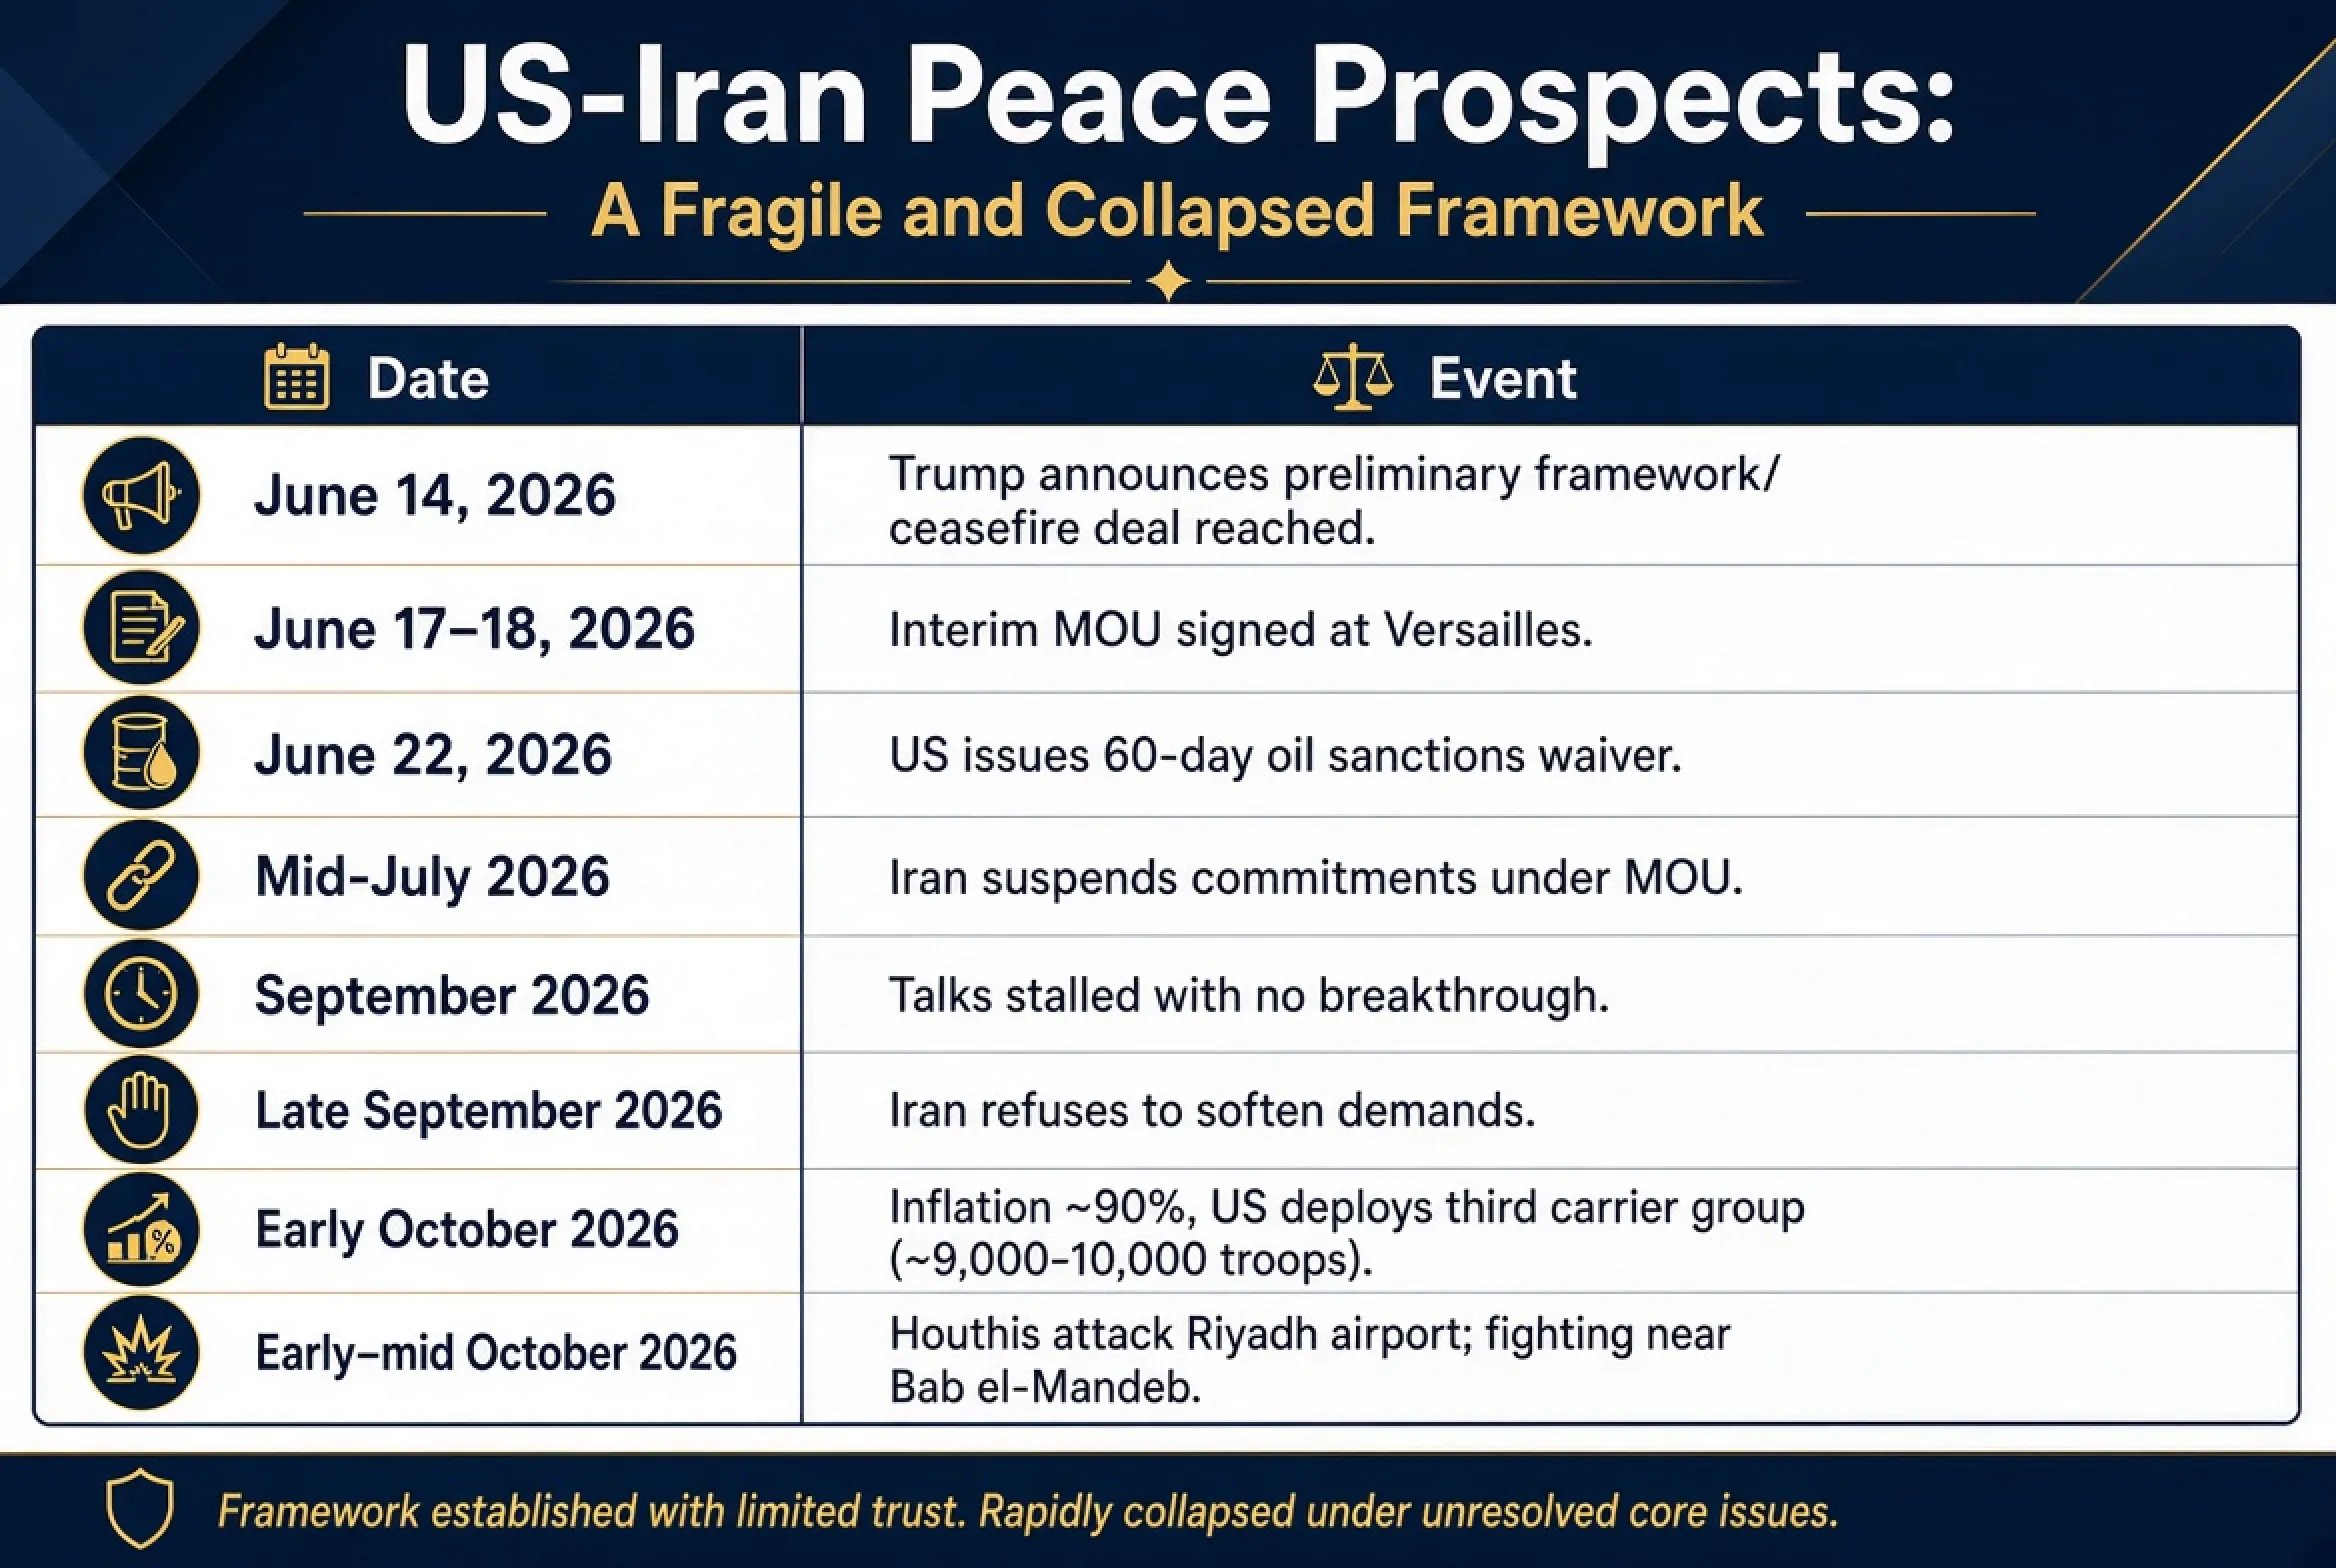
In June, it appeared the crisis might be over. On June 14, President Trump announced a peace deal had been reached. An interim MOU was signed at Versailles on June 18, and the Hormuz reopening began. The US even waived Iran oil sanctions for 60 days. For a brief moment, futures curves shifted to contango as Wall Street aggressively priced in normalization.
Then, reality struck. On July 18, Iran declared the peace deal abandoned and resumed heavy attacks. By September 3, talks were described as "stalled," and by September 28, the two sides were "far apart," with Iran refusing to soften its demands. As of October 3, Iran's domestic inflation had reached approximately 90%, backing the regime into an economic corner, while the US sent an additional carrier and 10,000 troops to the region. While Gulf states are attempting to broker dialogue through Oman, the economic pain of 90% inflation limits Iran's political flexibility to make concessions. The probability of a near-term settlement appears exceptionally low.
Part VI: Paper vs. Physical – Wall Street’s Ultimate Delusion
The combination of phantom inventories and financialization has caused a massive fracture between Wall Street's financial futures (paper) and the actual delivery of crude (physical).
One of the most analytically important—and least visible—features of this crisis has been the divergence between financial futures markets and the physical crude market. In April 2026, physical dated Brent traded at a premium of over $30/bbl above front-month futures, indicating that deliverable oil was far scarcer than financial markets were pricing. The spread reached an unprecedented $38/bbl at its widest point, according to Bloomberg data. Futures traders, staring at their Bloomberg screens, appeared to be pricing in a swift political resolution; physical traders, dealing with actual oil on the docks, were reacting to immediate shortages.
Following the June peace deal, the curve shifted to contango. But after the July collapse, backwardation violently re-emerged. The front-month contract is now trading 20% above the sixth month as of September, and the physical premium has re-widened to approximately $20/bbl, driven by Middle East supply concerns, stronger demand for prompt barrels, and intense refiner competition. Screen-visible prices in the paper market may not accurately reflect prices realized in the physical market.
Yet, sell-side analysts remain stubbornly anchored to their spreadsheets. Morgan Stanley sees 1Q27 Brent at $100/bbl; Goldman Sachs forecasts a 2027 Brent average of $80/bbl; UBS projects $85/bbl; ING forecasts $71/bbl; and Citi's base case sees Brent at approximately $70/bbl. The central tendency clusters around $75–80/bbl, below the current futures curve and entirely dependent on a conflict resolution timeline that remains deeply uncertain. But history provides a clear lesson: when paper and physical diverge this sharply, the physical market always forces convergence—and that convergence is invariably upward.
Part VII: The Recession Trigger and the AI Equity Bubble
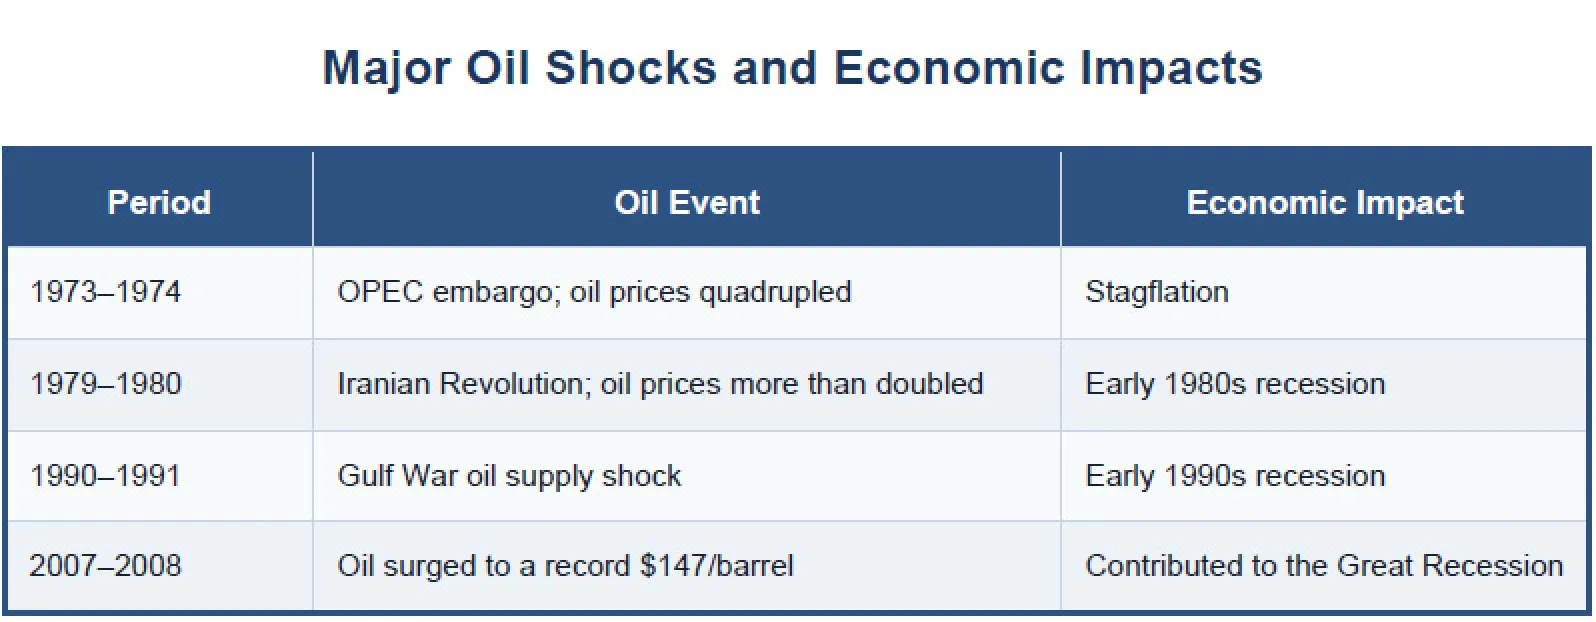
The correlation between oil price shocks and US recessions over the last 50 years is among the most robust in macroeconomics. Every major US economic contraction of the past 50 years was preceded by an oil price shock. Five of the last seven US recessions were preceded by increases in oil prices. The transmission mechanism is relentless: a sharp rise in oil prices causes overall spending growth to slow and reduces purchases of other goods, hitting the middle class with what amounts to a massive, regressive tax.
While the modern US economy is more resilient than it was in the 1970s (energy now consumes under 4% of consumer spending versus 9% in 1980, according to the BEA), oil shocks remain dangerous when they coincide with pre-existing financial vulnerabilities. And those vulnerabilities are glaring today.
Meanwhile, equity markets are showing resilience driven entirely by artificial intelligence optimism, but the concentration of market performance in a handful of technology firms makes the market exceptionally vulnerable. AI-related technology capex requires massive amounts of baseload electricity and grid expansion. You cannot power a multi-trillion-dollar AI infrastructure buildout without abundant, affordable energy, and you cannot finance it when the cost of money is structurally higher.
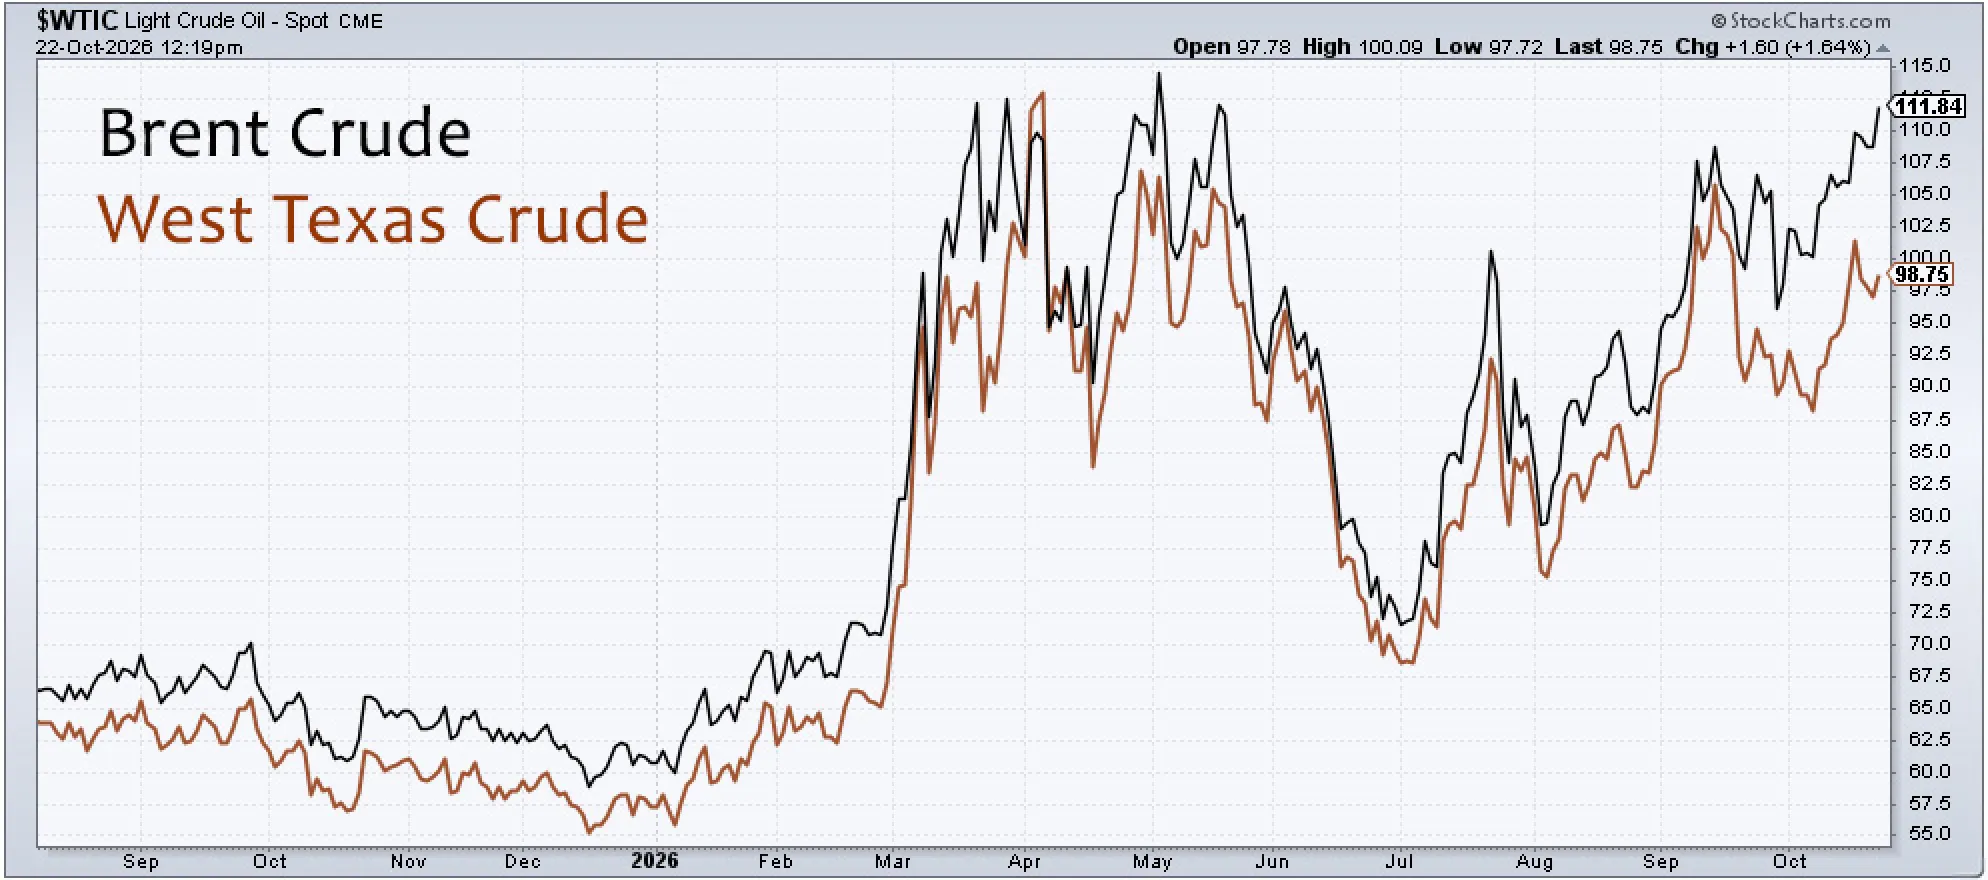
With WTI currently at $99.35 and Brent at $112.40, we are approaching the sustained $100 threshold that historically reshuffles market leadership. A re-escalation that closes Bab el-Mandeb simultaneously with Hormuz, or a direct strike on Saudi production infrastructure, could easily push prices toward the $120–$150 range. When the world spends more of its total economic output on oil and energy—as it did in 1984 and 2008—the cost becomes so heavy that people and businesses across the globe are forced to cut back sharply on oil use, causing widespread and lasting drops in demand. The combination of energy-driven inflation, Fed policy tightening, stretched consumers, and concentrated AI/tech equity valuations creates a compounding risk that is not easily absorbed.
Conclusion: Investment Implications for the Great Rotation
The oil market is not experiencing a single crisis. It is experiencing five simultaneous ones: a supply shock from the war, a collapse in refining capacity, a supertanker logistics shortage, a strategic reserve depletion, and a diplomatic impasse with no clear resolution. The paper market continues to underestimate the severity of the physical supply constraint.
What does this mean for the financial markets? It means a profound regime change. We are witnessing the death of the "easy money" era. For the last decade, we have been in a "summer" season for financial paper assets—stocks, bonds, and digital concepts. I believe we are now entering the winter for paper assets and the summer for hard, tangible assets.
The Death of the 60/40 Portfolio: The traditional balanced portfolio relies on bonds to hedge equity risk. But in a world of structurally higher inflation driven by energy and logistics shortages, bonds will act as "return-free risk." Rising yields will crush both fixed-income portfolios and the long-duration tech stocks that dominate the major indices.
The Great Capital Rotation: Capital must inevitably rotate from "things that click" to "things you can drop on your foot." Investors must pivot toward the companies that produce, refine, and transport physical necessities. Upstream energy producers, midstream pipelines, offshore drillers, and VLCC tanker operators stand to generate massive free cash flow as the world desperately tries to rebuild the infrastructure it spent a decade ignoring.
The Precious Metal Imperative: As central banks eventually face the reality that they cannot hike rates to 8% to crush inflation without bankrupting the sovereign debt structure, they will be forced to tolerate higher inflation and monetize the debt. This provides the ultimate macroeconomic tailwind for precious metals. In my opinion, gold and silver are no longer just hedges; they are mandatory core holdings for capital preservation in an era of fiscal dominance.
The laws of economic gravity, suspended for years by central bank liquidity and the illusion of phantom SPR inventories, are about to be violently reasserted by the physical limitations of the natural resource markets. Wall Street hates change, and the public usually jumps on board a trend only in its final stage. The wealth transfer of the next decade will flow from those holding financial illusions to those who own the physical realities of the global economy. Position your portfolios accordingly.



Comments
Log in or sign up to join the conversation.