

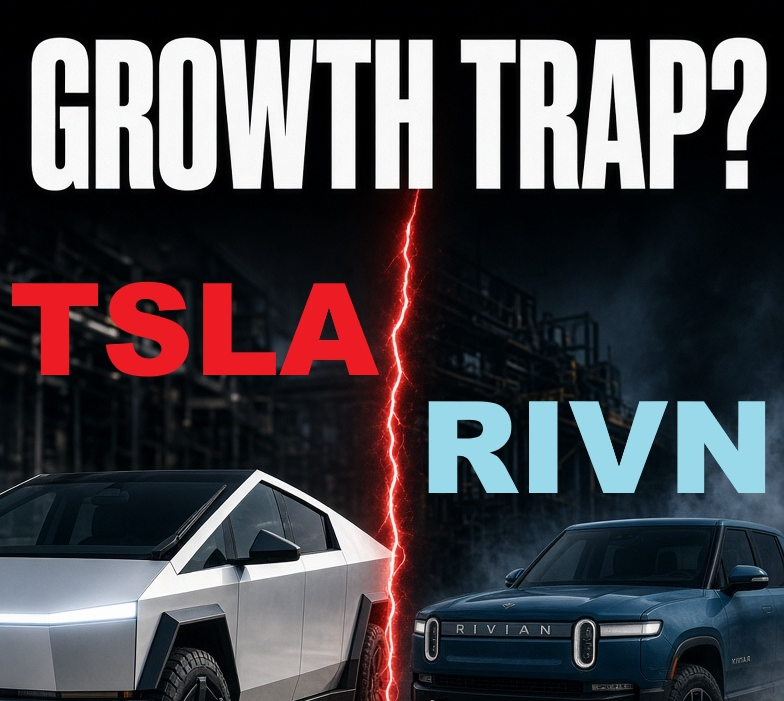
The 72-28 headline score favoring Tesla (TSLA) over Rivian Automotive (RIVN), generated by the interactive SEC-data duel, may appear at first glance a straightforward assessment of corporate health. A closer reading of the underlying filings that power that same duel, however, reveals a more nuanced picture: Tesla’s seemingly muted growth metrics conceal a durable operational engine that Rivian’s rapid revenue expansion has yet to support. The central tension lies between the appeal of high percentage growth and the uncompromising requirement of cash-flow generation. While Rivian’s 48.11% year-over-year revenue growth attracts attention, it stands in sharp contrast to the company’s limited ability to convert that top-line expansion into sustainable value—an inconsistency that Tesla’s more measured growth trajectory largely avoids, as the live factor-by-factor breakdown on the duel page makes immediately visible.
Understanding Tesla’s dominance in this comparison requires moving beyond the revenue line to the mechanics of profitability and efficiency that the duel algorithm weights. Tesla’s operating margin of 4.59% stands in stark contrast to Rivian’s –66.55%. This is not merely a difference of degree but of kind. A positive operating margin indicates that Tesla’s core activities generate surplus after covering operating expenses; Rivian’s negative margin implies that each dollar of revenue is accompanied by more than 66 cents in operating costs. The gap is reinforced by operating cash margins: Tesla at 15.55% versus Rivian at –14.46%. Tesla is extracting value from operations; Rivian is consuming cash to sustain growth. In a capital-intensive industry such as automotive manufacturing, the capacity to fund expansion internally constitutes a meaningful source of resilience—precisely the structural edge the interactive comparison quantifies.
Cash-flow generation remains the most decisive differentiator highlighted by the duel. Tesla’s free-cash-flow (FCF) margin of 6.56% corresponds to an absolute FCF base of $6.22 billion, conferring substantial financial flexibility. Rivian’s FCF margin of –46.20% produces a negative FCF base of –$2.49 billion. This figure signals that Rivian is not merely failing to generate cash from operations but is consuming capital at a rate that outpaces its revenue growth. The resilience analysis embedded in the same duel flags the associated risk explicitly: Rivian is growing without generating cash. Such a pattern implies continued reliance on external financing, exposing the company to vulnerability should capital markets tighten or investor sentiment shift. Tesla’s positive FCF, by contrast, reflects a self-sustaining model less dependent on external capital.
Efficiency metrics further illuminate the operational maturity gap that the eight-factor scoring system isolates. Tesla’s asset turnover of 0.64x meaningfully exceeds Rivian’s 0.36x, indicating greater revenue generated per dollar of assets employed. Receivables turnover tells a similar story: Tesla’s 23.20x ratio points to faster conversion of sales into cash relative to Rivian’s 14.56x. These figures suggest that Tesla maintains a more streamlined operating structure and more effective working-capital management. For Rivian, the lower turnover ratios point to potential bottlenecks in production or sales processes that lengthen cash-conversion cycles and tie up capital in inventory or receivables.
Return on invested capital (ROIC) supplies an additional lens on value creation. Tesla’s ROIC of 4.05% is positive, indicating returns that exceed the cost of capital—a critical condition for long-term value generation. Rivian’s ROIC of –44.97% is deeply negative, signaling value destruction with each incremental dollar invested. This outcome is consistent with the broader profile of negative operating and free-cash-flow margins and reinforces the conclusion that Rivian’s growth currently exacts a material cost in shareholder value—the same conclusion the weighted duel algorithm reaches with its 72-point verdict for Tesla.
Consistency checks within the resilience analysis further support the durability of these profiles. Tesla’s metrics are flagged “OK” across growth-versus-FCF, ROIC-versus-Sloan, and debt-versus-cash dimensions, pointing to a stable and predictable financial architecture. Rivian receives a “RISK” designation on the growth-versus-FCF check, underscoring the unsustainable character of its present trajectory. Although Rivian’s debt and cash positions remain manageable at present, the absence of cash-flow generation poses a longer-term threat to financial stability. The Sloan ratio is negative for both companies (–1.48% for Tesla and –2.28% for Rivian), yet this metric is secondary to the more consequential disparities in cash generation that the interactive duel surfaces in real time.
Discounted-cash-flow (DCF) parameters reinforce the fundamental differences in scale and risk. Tesla’s revenue of $94.83 billion substantially exceeds Rivian’s $5.39 billion, reflecting Tesla’s established market position. Weighted-average cost of capital stands at 11.21% for Tesla and 8.41% for Rivian. The lower WACC for Rivian may appear advantageous, yet it is likely offset by the elevated risk associated with negative cash flows and deeply negative ROIC. Terminal growth rates—2.60% for Tesla and 3.00% for Rivian—are relatively close, but the bases to which they are applied differ dramatically. Tesla’s ability to generate positive FCF at a 6.56% margin supplies a solid foundation for long-term valuation; Rivian’s –46.20% FCF margin exerts a material drag.
In conclusion, the 72-28 score in favor of Tesla, produced by the transparent eight-factor SEC-data duel reflects more than superior profitability. It represents a comprehensive assessment of operational efficiency, cash-flow generation, and value creation. Tesla’s revenue growth of 5.19% is consistent with the maturity and scale that permit a focus on margin expansion and cash-flow optimization. Rivian’s 48.11% revenue growth, while impressive on the surface, remains unsustainable absent corresponding improvement in profitability and cash generation. The data indicate that Tesla’s business model is more resilient and better positioned for sustained value creation, whereas Rivian’s expansion is presently financed by capital consumption rather than operational efficiency. Investors and analysts should therefore approach Rivian’s growth trajectory with caution: without material improvement in margins and cash flow, the current path may prove difficult to sustain. The structural advantage resides with Tesla, whose consistent positive cash flows and superior efficiency metrics provide a more secure foundation for future performance—an advantage that can be examined, reweighted, and stress-tested live on the duel page itself.


Comments
Log in or sign up to join the conversation.