

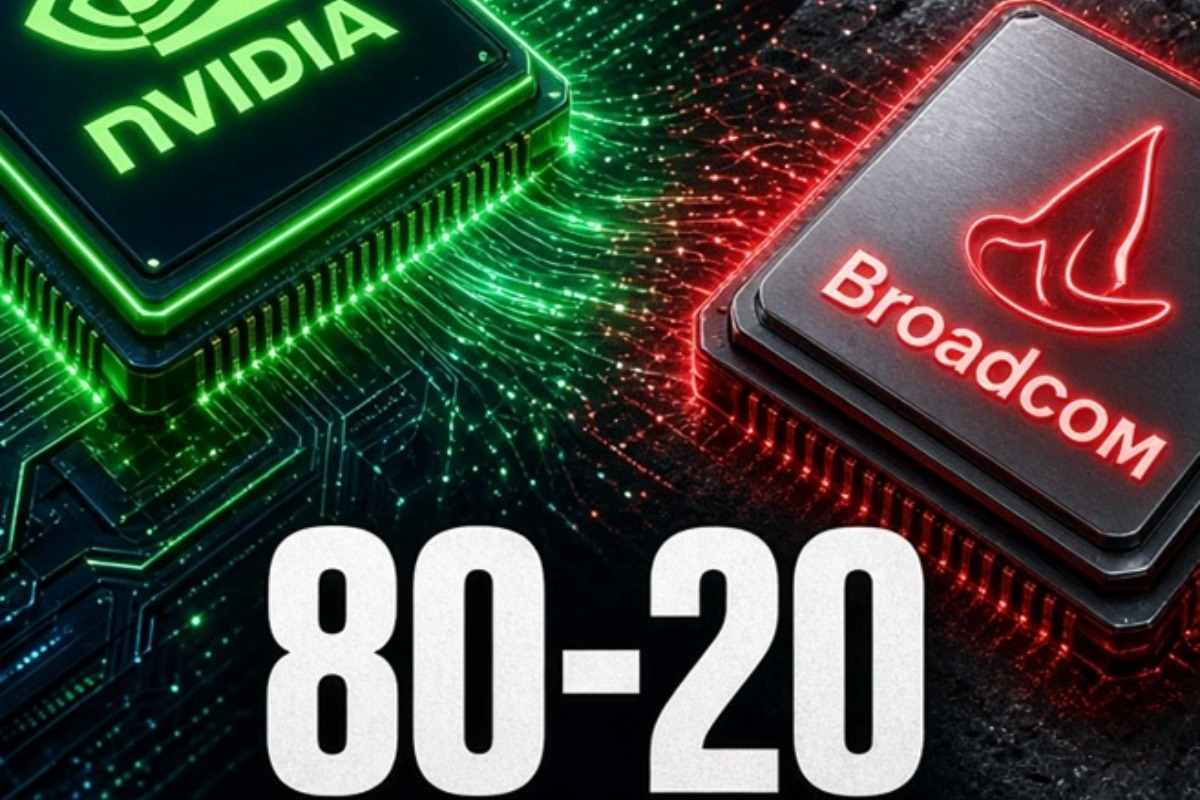
The headline score of 80-20 in favor of NVIDIA (NVDA) over Broadcom (AVGO) might initially suggest a simple superiority in profitability. A deeper examination of the underlying SEC EDGAR data, however, reveals a more nuanced reality. This is not merely a case of one company being slightly more profitable than the other; it is a demonstration of a fundamental divergence in business-model architecture, capital efficiency, and growth sustainability. The data do not simply show NVIDIA winning—they show NVIDIA operating on a different financial plane, one in which growth functions as a self-reinforcing engine of capital returns rather than a byproduct of demand. The relevant question is not whether NVIDIA is better, but what the specific mechanics of its dominance imply for the sustainability of its valuation and for Broadcom’s relative positioning in the semiconductor landscape.
At the heart of NVIDIA’s commanding lead is its revenue growth of 100.05% year-over-year, compared with Broadcom’s 24.38%. This is not a marginal difference; it is a structural chasm. In the semiconductor industry, where cycles are notoriously volatile, such growth is rare and typically unsustainable. When paired with NVIDIA’s operating margin of 60.38% versus Broadcom’s 39.89%, the picture shifts from a cyclical boom to a structural advantage. NVIDIA is not merely growing faster; it is growing more profitably. This combination indicates that NVIDIA’s pricing power and cost structure differ fundamentally from Broadcom’s. The data show that NVIDIA’s business model can absorb massive growth without diluting margins—a feat Broadcom, while solid, cannot match. The distinction extends beyond unit volume to the nature of the products sold and the market’s willingness to pay a premium for them.
Capital-deployment efficiency further underscores this structural edge. NVIDIA’s return on invested capital (ROIC) of 51.01% dwarfs Broadcom’s 14.13%. This is not a minor discrepancy; it reflects a business model that generates significantly more value from every dollar invested. In an industry characterized by high capital expenditures and potentially thin margins, NVIDIA’s ROIC points to a near-monopolistic position in its core markets and to returns that are virtually unmatched. Broadcom’s ROIC, while respectable, is consistent with a more traditional semiconductor model in which growth is achieved through incremental investment rather than explosive, high-margin expansion. The divergence in ROIC is critical because it directly affects the ability to compound value over time. NVIDIA’s elevated ROIC implies that it can reinvest earnings at a substantially higher rate of return, producing a compounding effect that Broadcom cannot replicate.
Earnings quality provides additional differentiation. NVIDIA’s operating cash margin of 47.57% and free-cash-flow (FCF) margin of 47.50% are nearly identical, indicating a high degree of cash-conversion efficiency. Broadcom’s corresponding figures—an operating cash margin of 43.10% and an FCF margin of 42.13%—are also efficient, yet the gap is notable. More importantly, NVIDIA’s asset turnover of 0.83x is more than double Broadcom’s 0.36x, demonstrating that NVIDIA generates significantly more revenue per dollar of assets employed. In a capital-intensive industry, this is a powerful indicator of operational excellence. It implies that NVIDIA is not only profitable but highly efficient in its use of resources. Broadcom’s lower asset turnover points to a more asset-heavy model that can constrain the pace at which profits scale relative to NVIDIA’s.
Receivables turnover offers further insight. Broadcom’s ratio of 5.90x is slightly higher than NVIDIA’s 5.30x, indicating marginally faster cash collection. This minor advantage is outweighed, however, by NVIDIA’s superior growth and profitability metrics. NVIDIA’s ability to maintain high margins and rapid growth while managing its receivables suggests that customers accept its terms, reinforcing its market power. The data imply that NVIDIA’s pricing power is sufficiently strong to dictate commercial terms even while expanding at a rate that would strain most competitors.
Valuation metrics derived from a discounted-cash-flow (DCF) model reflect these fundamental differences. NVIDIA’s revenue of $215.94 billion and FCF base of $102.58 billion substantially exceed Broadcom’s $63.89 billion and $26.91 billion, respectively. The three-year CAGR of 100.05% for NVIDIA, compared with 24.38% for Broadcom, drives the forward valuation. NVIDIA’s WACC of 8.95% is slightly higher than Broadcom’s 8.01%, reflecting higher perceived risk. The terminal growth rate of 3.00% applied to both companies implies long-term convergence in growth expectations. Fair-value projections show NVIDIA’s price rising from $176.47 to $202.24 over three years and Broadcom’s rising from $205.67 to $233.87. Although Broadcom’s absolute price level is higher, the percentage growth trajectories are similar, indicating that the market is already embedding NVIDIA’s superior fundamentals in a higher base valuation.
The resilience assessment adds another dimension. NVIDIA’s FRI score of 64, with no penalties, signals a stable financial position. Broadcom, while demonstrating consistency in growth versus FCF and ROIC versus Sloan, carries a risk flag related to its debt-to-cash ratio. With a debt-to-equity ratio of 0.8 and a cash-to-debt ratio of 0.3, Broadcom’s leverage is elevated. This suggests that, despite its profitability, Broadcom’s financial structure is more vulnerable to shocks than NVIDIA’s. The data imply that NVIDIA’s balance sheet is stronger, affording greater flexibility to fund growth and to withstand economic downturns.
The Sloan ratio, a measure of earnings quality, reinforces the same conclusion. NVIDIA’s Sloan ratio of -6.92% is better than Broadcom’s -11.90%, indicating that NVIDIA’s earnings rely less on non-cash items. This metric is critical for assessing profit sustainability: a lower (more favorable) Sloan ratio increases confidence that reported earnings are more likely to be repeated. In conclusion, the 80-20 score is not merely a reflection of NVIDIA’s current profitability; it is a testament to structural advantages in growth, efficiency, and capital returns. The data portray a company that is not simply winning the present cycle but is positioned to dominate the next. Broadcom remains a solid performer, yet it operates within a more traditional semiconductor model characterized by lower growth, lower margins, and higher leverage. The relative ranking is unambiguous: NVIDIA is the superior company on fundamental grounds. The open questions are whether NVIDIA’s current growth rate can be sustained over the longer term and whether market expectations are already fully priced in. The evidence provides a strong case for NVIDIA’s dominance while also highlighting the risks that accompany elevated expectations and the potential for mean reversion in a cyclical industry.



Comments
Log in or sign up to join the conversation.