
.jpg")
Markus Winkler- Unsplash
SPX Monitoring purposes; Long SPX on 10/31/25 at 6840.20.
Our gain 1/1/24 to 12/31/24 = 29.28%; SPX gain 23.67%
Our Gain 1/1/23 to 12/31/23 SPX= 28.12%; SPX gain 23.38%
Monitoring purposes GOLD: Long GDX at 75.76; 9/29/25
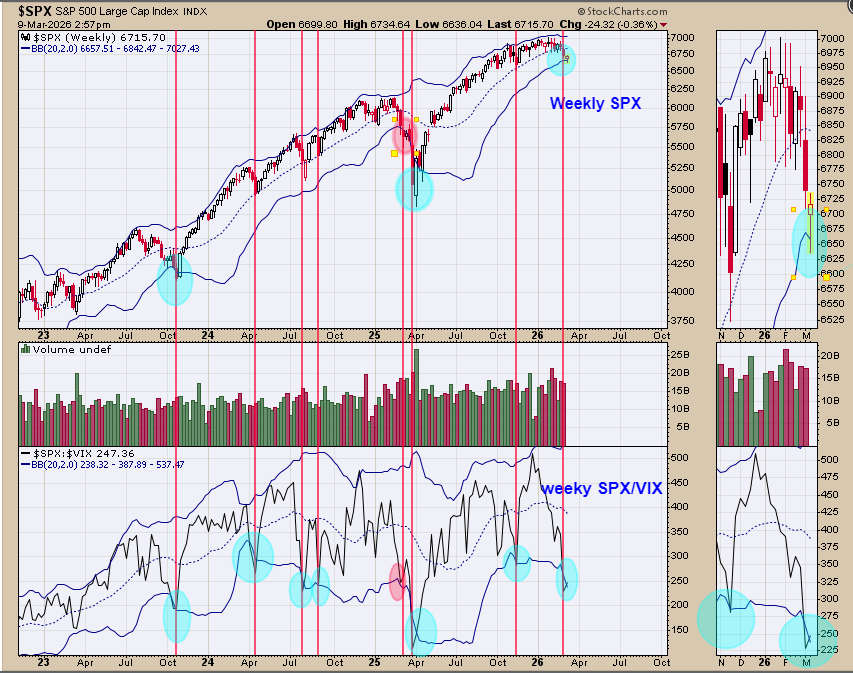
Above is the weekly SPX and the bottom window is the weekly SPX/ VIX. We shade in green circles the times when the weekly SPX/VIX ratio broke its lower Bollinger band and the weekly SPX broke its lower Bollinger band. There was one time the SPX fail to make a low when the SPX/VIX ratio and SPX broke its lower Bollinger band and that was last March (pink circle). In seven of the eight times when either or both weekly SPX/VIX or SPX broke it’s lower Bollinger band the market was at a low; which work out to 88% chance the market is making a low here.
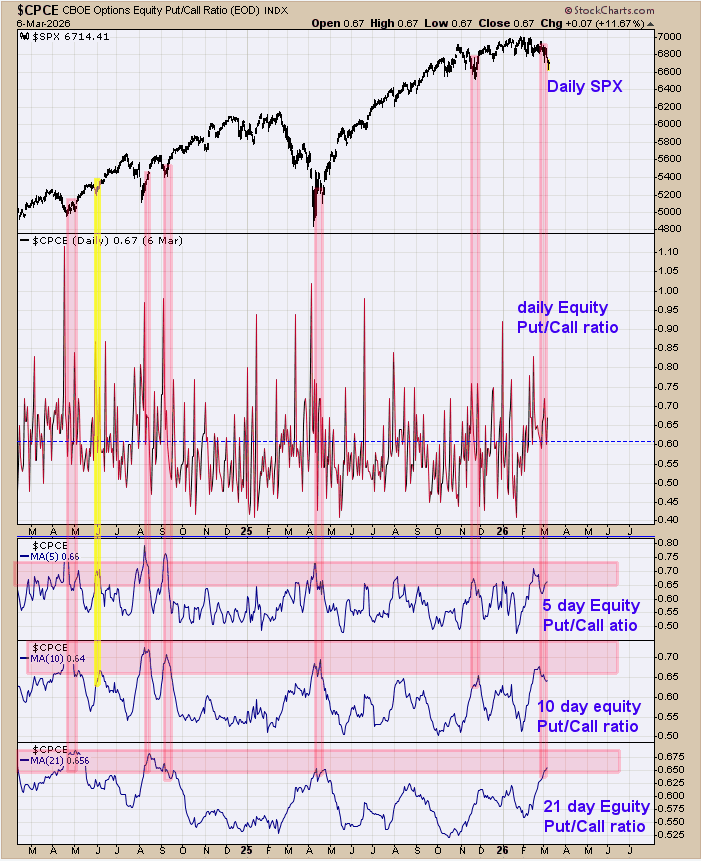
The bottom window is the 21 day average of the equity Put/Call ratio; next higher window is the 10 day average and next higher window is the 5 day average. We shaded in pink the times when all three moving averages of the equity put/call ratio reached .65 and higher. This chart goes back to March 2024 (two years). The previous five times when all three moving average reached .65 the SPY was at an intermediate term low. Could see short term “back and forth” on the SPX but it appears a base is forming that may lead to a rally that may tests the recent highs if not higher.
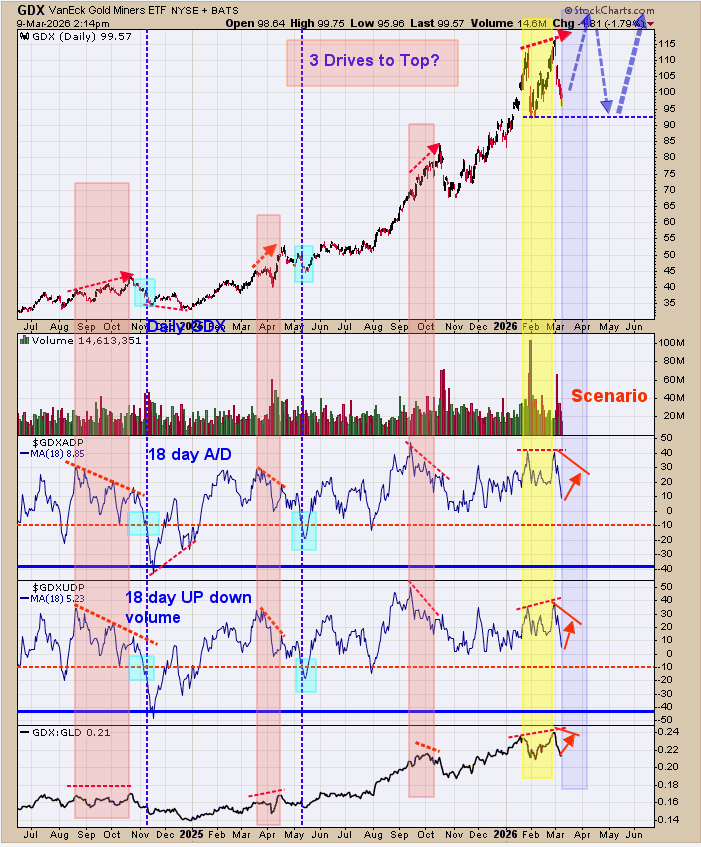
A major gold stock rally has begun and according to cycle analysis could last into 2036. Previous pull backs in GDX formed when there was a divergence in the 18 day average of the up down volume and 18 day average of the advance/decline (shaded in pink). At the last high there where no divergence. (noted in shaded yellow). A scenario that may develop is that a ‘Three Drives to a Top” may be forming (which is not a longer term topping pattern but rather a minor pull back in an uptrend). This pattern has three higher highs where the pull back off the second high had high volume. We have seen the third high yet which we believe is coming. If the third high develops in GDX, there is a god chance the GDX/GLD ratio may not reach a new high and possibly 18 day average of the up down volume and 18 day average of the advance decline. This setup would than produce a divergence. We are staying long GDX for now. Long GDX on 9/29/25 at 75.76.

Comments
Log in or sign up to join the conversation.